
Understanding Google Analytics is the first step towards a more complete understanding of your website and its visitors. By going through all of the reports, you will be able to make better decisions and improve your website.
According to BuiltWith, there are over 28 million websites that actively use Google Analytics. Many of these site admins are not professionals, but they still understand how important analyzing a site can be.
In this tutorial, I will try to show you the basics, and introduce you to the world of Google Analytics from a WordPress perspective.
I will go through the reports, and try to briefly explain the most important things that you need to know about Google Analytics for a WordPress website – from setting up a free account and installing everything, to showing you how to find simple reports that will help you understand your website and users. Please note that if you are using a different Content Management System (CMS), the installation part might be different, but the Google Analytics tips remain the same.
Table of contents
- What is Google Analytics?
- Why you need Google Analytics
- How to set up a free account
- Understanding the concept of the Google Analytics tool
- Google Analytics overview
- FAQs
- Conclusion
What is Google Analytics?
Google Analytics is actually one of the most popular Google services. This tool allows anyone to track their websites.
The tool connects directly to your website in order to collect a vast amount of data. This data will then be analyzed and presented to you. By analyzing the information you receive from Google Analytics, you will be able to understand who your visitors are and what they do on your site. This will help you understand your audience better, create stronger content, and sell more of your services or products.
Why you need Google Analytics
All of the information gathered by Google Analytics will help you to make decisions that will hopefully empower you to propel your site forward and make it better. The information you receive can impact several different fields:
- Marketing – learn who your visitors are and where they come from. Understand the content they like, and give them exactly what they need. Start segmenting your customer base and sell more.
- SEO – improve the content that doesn’t perform well, and put even more focus on pages that generate the most clicks to your site. Learn which keywords bring in the traffic, and understand what pages people navigate to next.
- Site improvements – check the speed of your site, and see where you can improve. Compare your site to competitors and make it better.
Checking Google Analytics will become part of your daily routine once you understand how valuable this tool is to your website growth.
How to set up a free account
Before you can start using this free service, you will need an account. Fortunately, to register for Google Analytics, all you need is a free Google account. If you don’t have one, you can open one now to prepare for the analytics.
Sign up
Once your free Google account is ready, you can go ahead and open Google Analytics.
- Click on the “Start for Free” button.
- Log in to your Google account.
- Click on the “Start measuring” button.
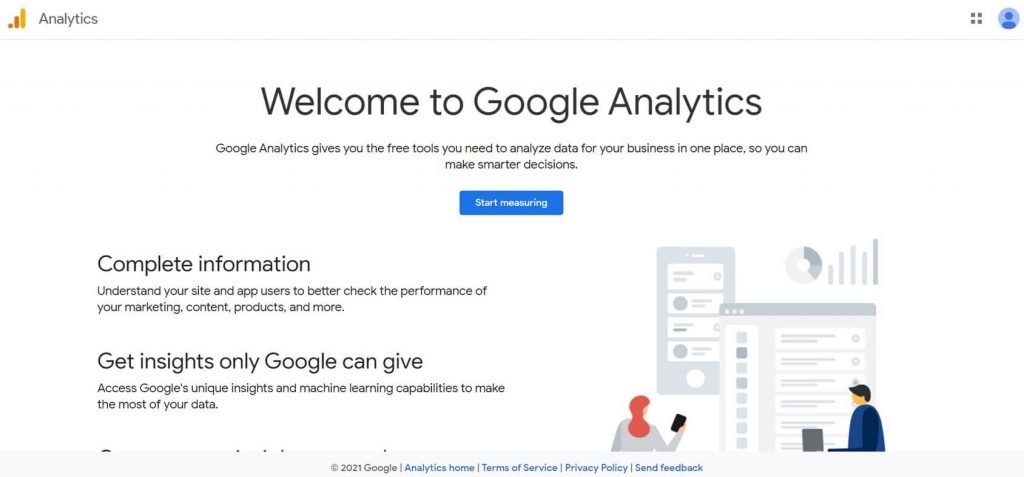
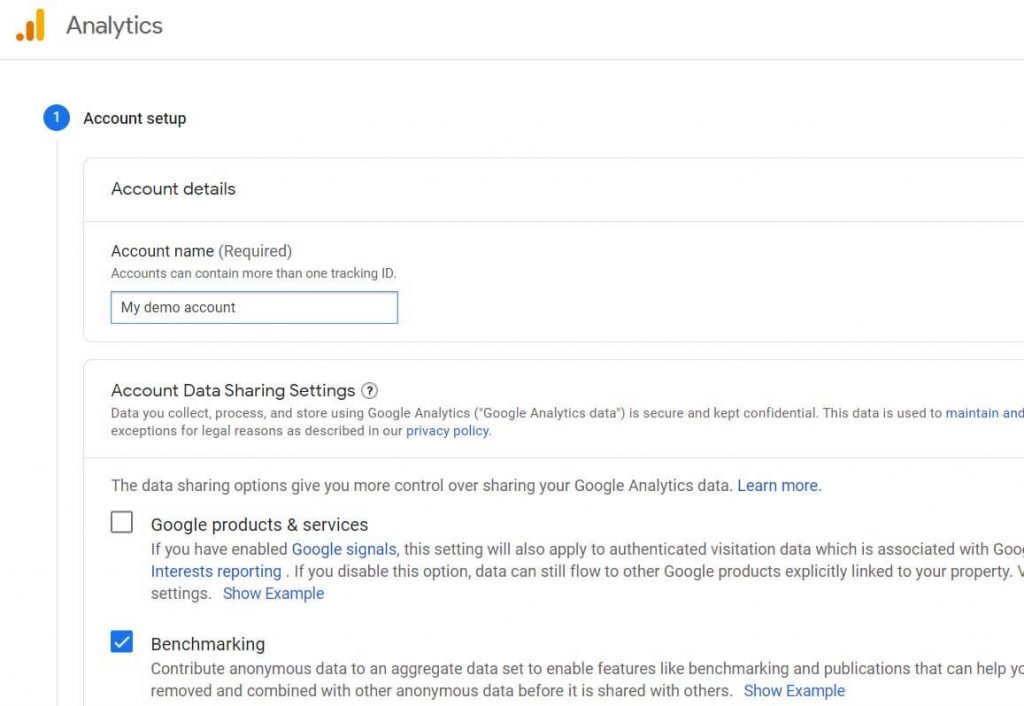
- Name your account.
- Add a property name (your site name).
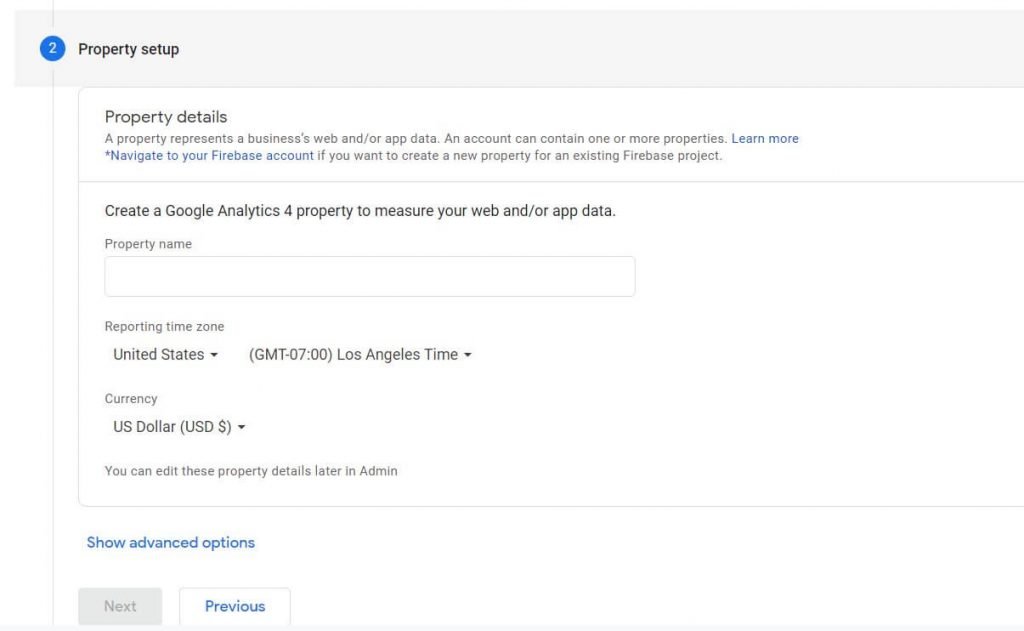
- Under Advanced settings, turn on the toggle to create a Universal Analytics property and add the URL of your site.

- Add business information and click on the “Next” button.
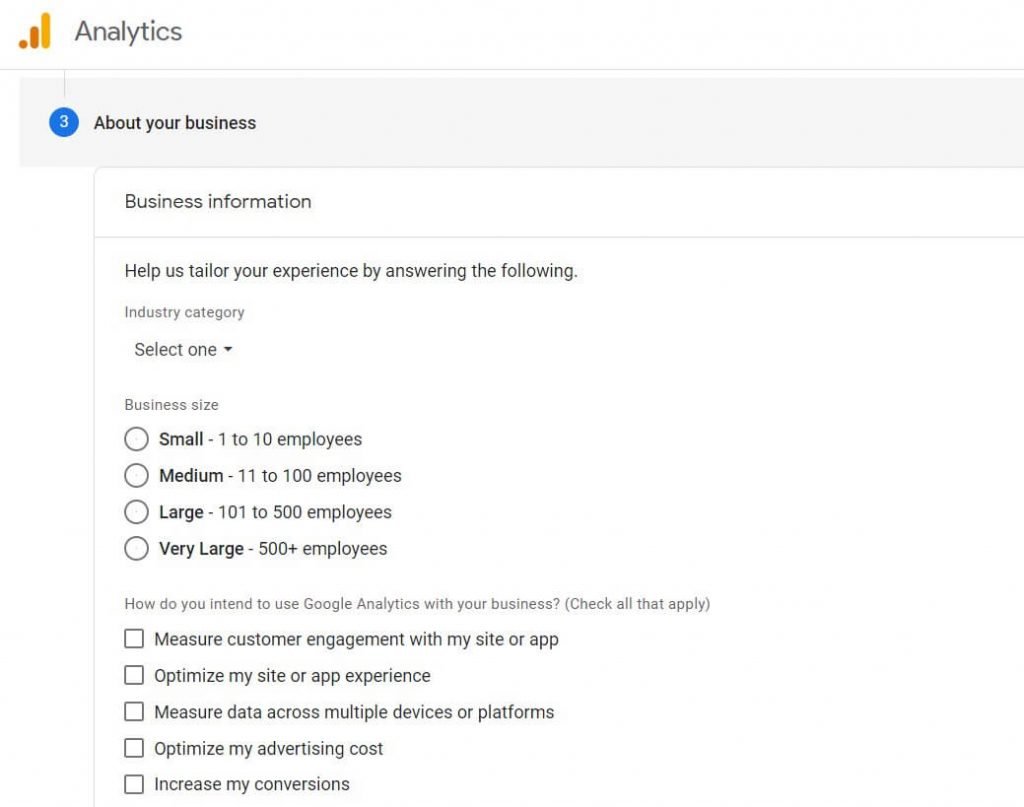
- Confirm the terms of agreement and customize email communication options to your preferences.
- Set up a data stream to start collecting data. Since we are learning about tracking a blog/website,
- click on the “Web” button.
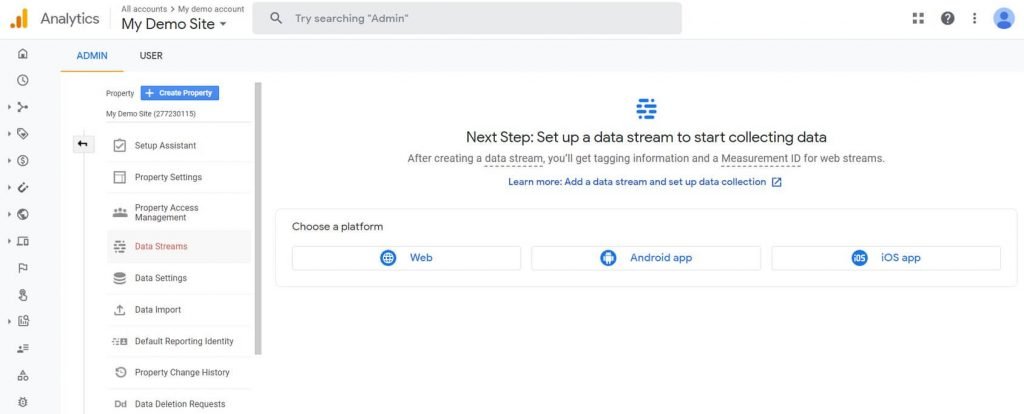
11. Add the URL and name of your website.
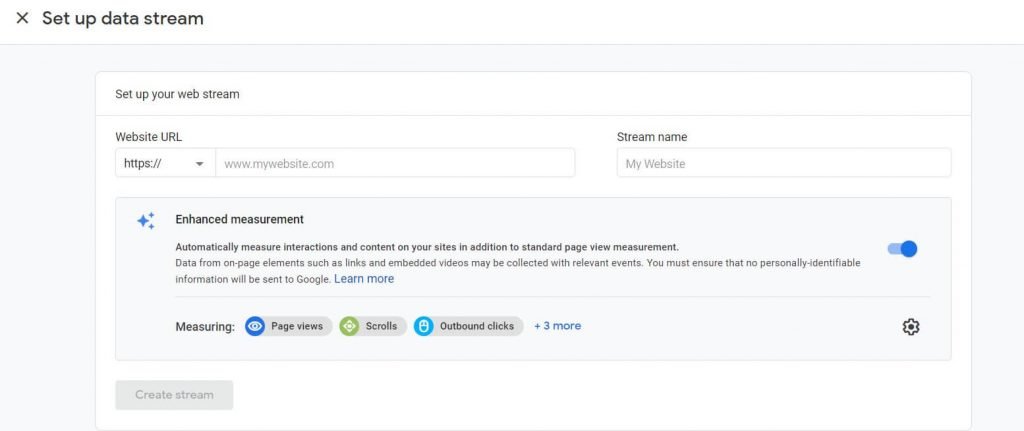
After this step, you will receive a measurement ID that needs to be connected to your site. This is a way of proving the ownership of the site and tethering it directly to Google Analytics so that the entire system can work properly.
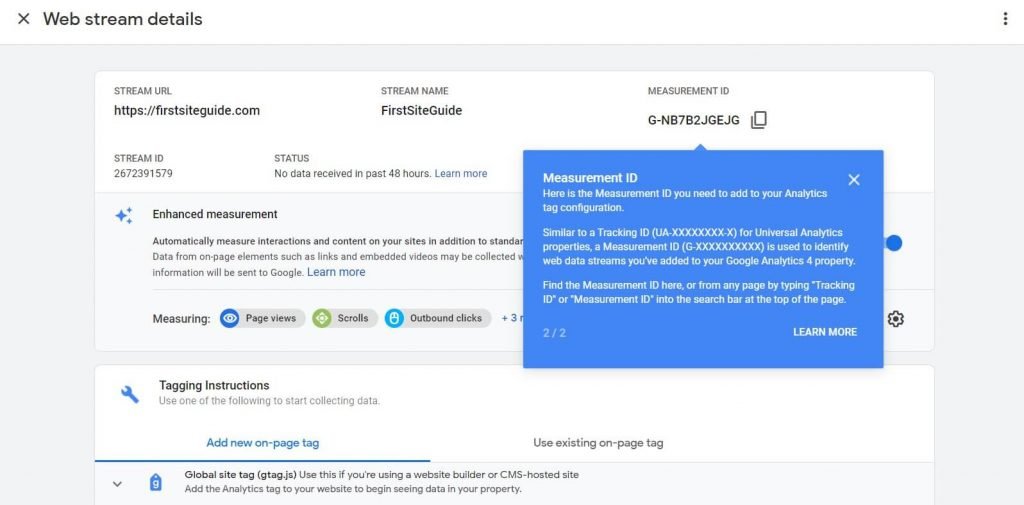
12. Under Tagging Instructions, choose the “Global site tag (gtag.js)” option.
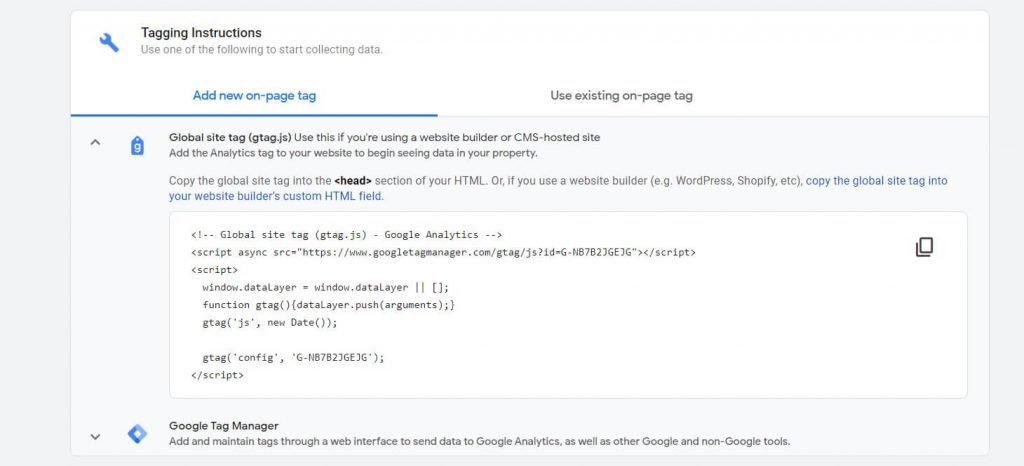
This will reveal a short script that contains your unique ID that I mentioned earlier. Keep this window open and choose one of the two ways to install the code on your site: add it manually, or use a WordPress plugin.
Add Google Analytics tracking code manually to your WordPress website
If you already know your way around WordPress and you are not afraid of handling things on your own, adding the code manually is quite a straightforward process.
However, before you proceed with manually editing WordPress files, I suggest creating a full backup of your site, because even the slightest error might render your site unusable.
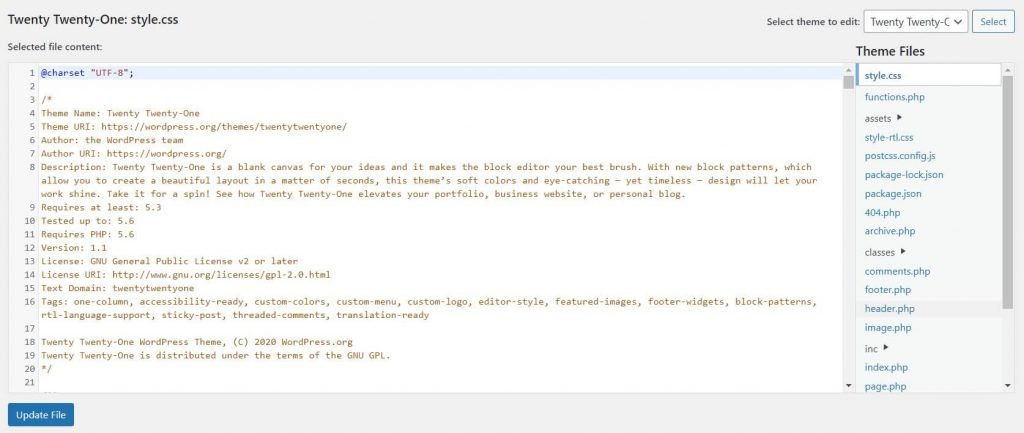
- Log in to your WordPress website.
- Navigate to Appearance -> Theme Editor.
- From the right-hand side of the screen, locate the “Theme Header” file (header.php) and click on it. This will load the code from the selected file.
- Copy the tracking code from Google Analytics.
- Paste the code right before the closing </head> tag.
- Update file.
As soon as you receive confirmation of a successful update, you’re done. Google Analytics has been successfully connected to your site, and it’s time to start tracking your first visitors! Usually, everything will start working in a couple of minutes, but don’t worry if you still don’t have the first statistics within the first 24 hours. This is normal, and in some cases, it takes a full day for the service to start working as it should.
Add Google Analytics tracking code to your WordPress website using the plugin
As you probably already know, WordPress comes with plugins that allow you to do practically anything. It’s not surprising that there are some great extensions that allow you to connect to Google Analytics in an easier way. Instead of handling files and code directly, you can manage everything through a proven and streamlined user interface.
Here are the most popular Google Analytics plugins for WordPress that you can quickly install and use to connect the service to your site:
In this tutorial, I will show you how to set up the first one from the list, MonsterInsights.
- Go to Plugins -> Add New.
- Search for “MonsterInsights”, a Plugin that has more than 3 million active users.
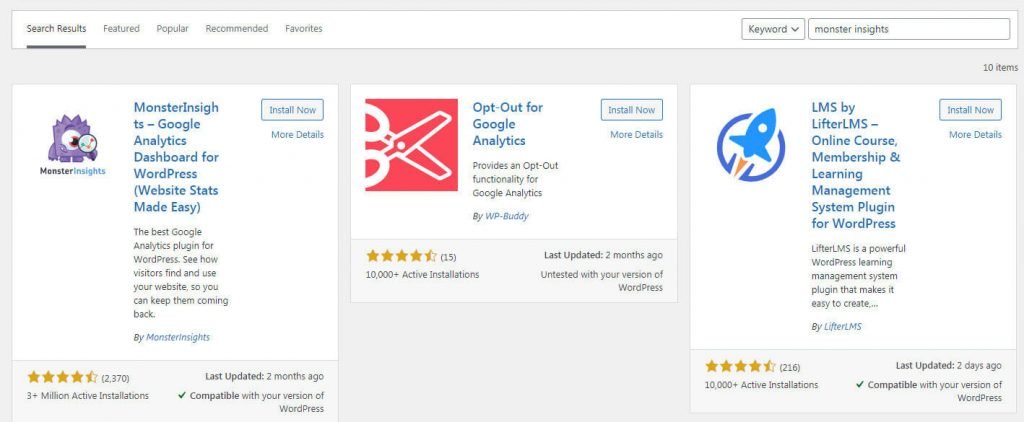
- Install and activate the plugin.
- Click on the “Launch the Wizard” button.
- Choose a category for your website.

- Click on the “Connect to MonsterInsights” button. This will open a new tab.
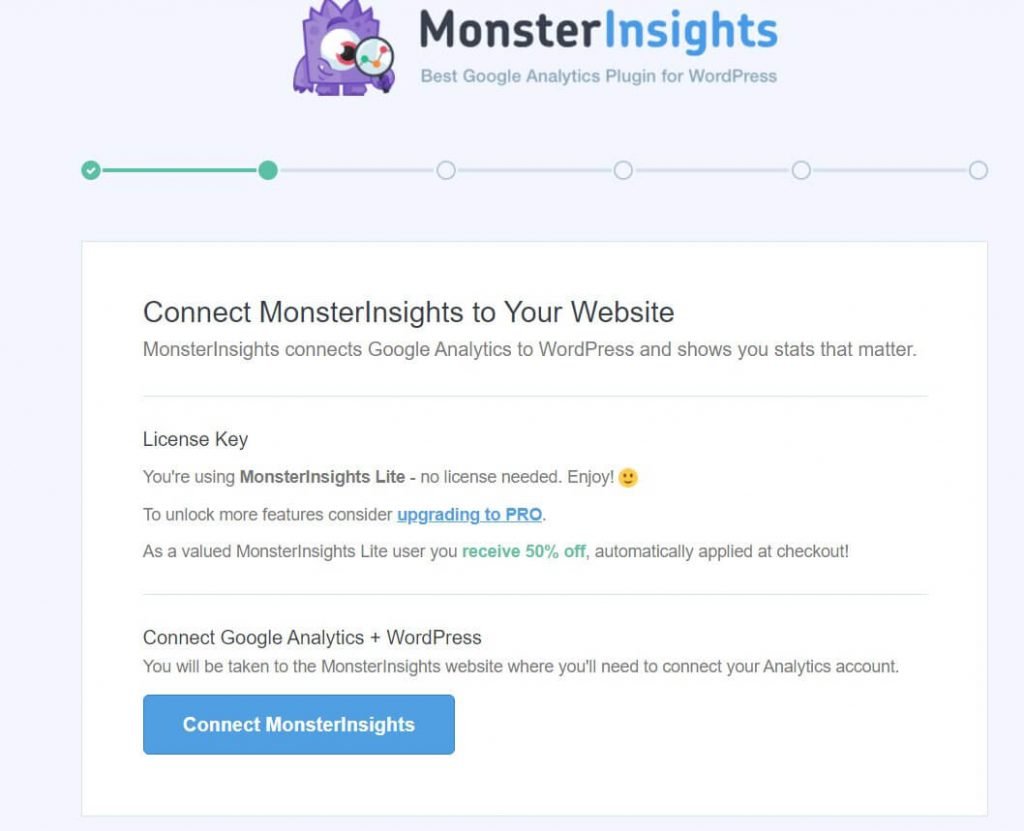
- Choose your Google account and log in.
- Click on the allow button to allow the plugin to access the necessary data.
- Choose the site from your list, and click the “Complete Connection” button.
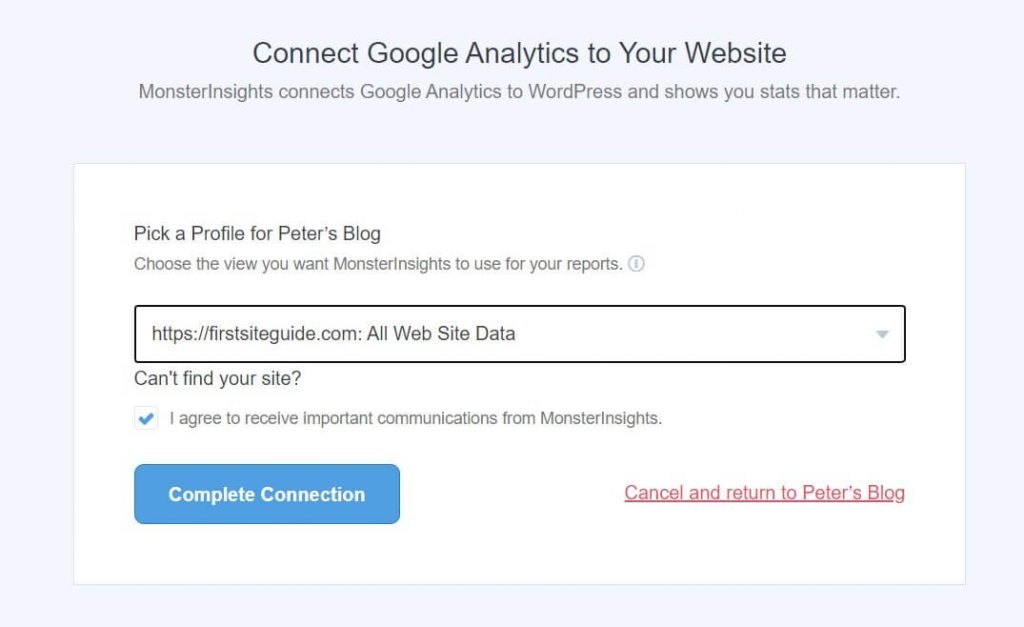
10. Wait for a few seconds for the setup to complete.
11. Go through options, and click on the “Save and continue” button.
12. Click on the button to finish the setup.
This action will take you back to your WordPress site. You have now officially completed the integration, and you will be able to start tracking your visitors in less than 24 hours.
The plugin will create a new menu item on your WordPress site, so you can always access your analytics details (reports) and settings from the Insights menu item located on the left-side menu.
Understanding the concept of the Google Analytics tool
Before the information is presented to you, Google Analytics works on the data to make it more understandable to the casual user. Because of that, you have to understand a few things.
Users vs sessions
The first important difference is between users and sessions. Many beginners mix users and sessions and think that they are the same, but the truth is quite the opposite.
Users
Users are unique individuals that access your site from one device. When a person loads any page on your website, they will be assigned a cookie – a small file where Google Analytics will document information about that user. If this user comes back to your site, they will be instantly recognized as a returning visitor. Another user that has not been assigned a cookie will be marked as a new user.
However, note that I highlighted that the user accesses the site with the same device. If the same person opens your site from another smartphone or a different computer, the cookie won’t be visible, and that user will be treated as a new one. Also, you can quickly delete all cookies from your browser if you open Advanced settings and find the “Clear browsing data” section where you can quickly delete “All cookies and site data”. This action would make you a “new user” for every site that you open.
Sessions
A session is a period of time during which a specific user does something on your site. Once the first page is opened, the session begins, and Google Analytics starts tracking the user’s behavior. This way, you can understand the user’s journey through your site.
What was the first page that the user opened? Where did they land next? What was the page on your site that made them navigate away? Those are just some of the answers collected from a session.
After the user has left your site, the session ends. If the same user comes back to your site in a couple of hours, days, or weeks, this would be treated as a new session. The user wouldn’t be counted as a new one, as long as the user is accessing your site from the same device with the previous cookie available.
Pageviews vs events vs transactions
Before we move into the details about how to use Google Analytics, I would like to briefly explain a couple more things about how the service works. Once you understand users and sessions, it is important to know the difference between pageviews, events, and transactions.
- Pageviews – shows you the number of times anyone opened a specific page on your site. If the same person opens the same page one hundred times, that would be counted as one hundred page views by the same user.
- Events – marks something a user does on your site. Each event has to be set up, but you can track if people filled out your forms, clicked specific menu buttons, and so on.
- Transactions – an event that specifically tells you when someone completed an eCommerce transaction through your site.
Now you know a little bit more about Google Analytics, and you’re ready to tackle the service.
Google Analytics overview
The first time you open Google Analytics, you might be intimidated by the sheer amount of information available. Fortunately, the service has been improving constantly, and Google continues to simplify things so that both beginners and professionals can get the most out of it.
In the following section, I will go through each tab available in Google Analytics and show you how to use it.
Home tab
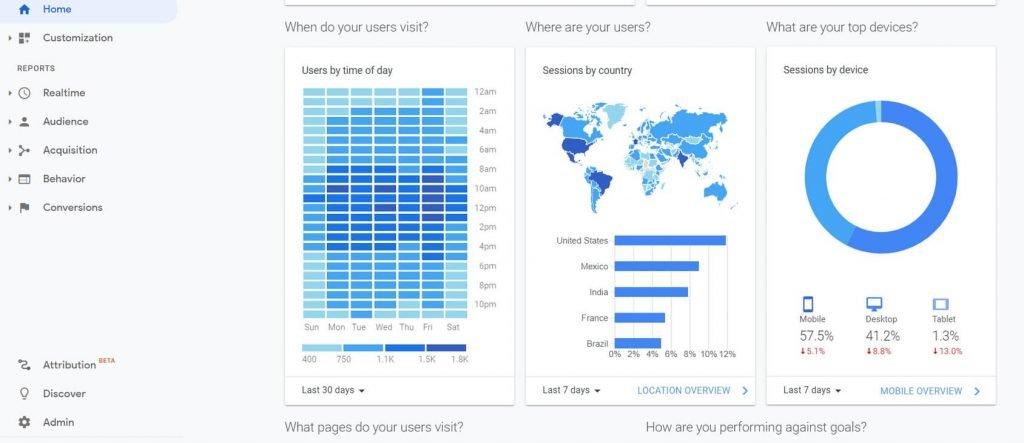
The main dashboard, known as the Home tab, holds all of the most important information about your site, spread into several widgets.
Here, you will access summarized information from other groups that I will show you later. If you want to quickly analyze the site, the home tab will show you:
- Number of users and sessions, revenue, and conversion rates.
- Number of active users – those who are currently on your site.
- Graph showing you where your traffic comes from (direct, organic search, referral, social, and more).
- Breakdown of session by country.
- Time of day when users load your site.
- Most visited pages.
- And more.
Each widget contains the basic filtration options. So, for example, you can quickly change the dates for your statistics and show the data for the last 30 days instead of just the last 7 days.
If you want to learn more about some specific information, there’s a link to the full report in the lower-right corner of each widget.
Analytics Intelligence – search function
Instead of navigating through a menu to find simple answers, Google introduced Analytics Intelligence – an artificial intelligence tool that can understand your questions.
To start using it, simply find the search bar at the top of your Google Analytics page. Type your question, and let the service answer it.
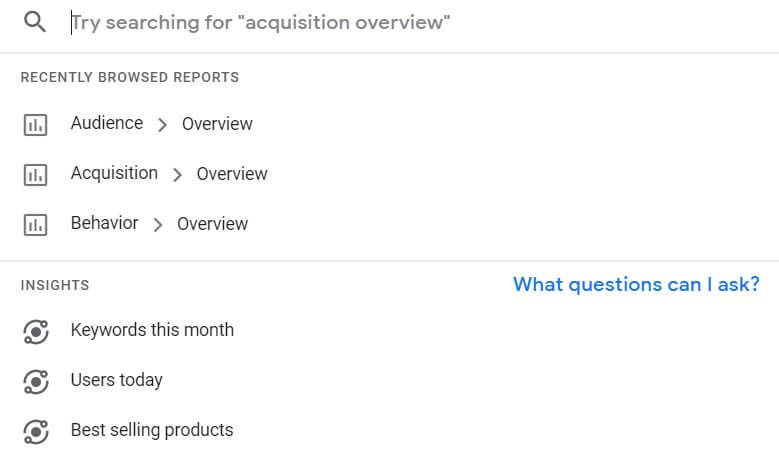
You can ask questions like:
- How many users did I have last week?
- What campaigns have the most sessions?
- Why did my user numbers change last week?
- And much more.
Customization
Once you start using Google Analytics on a regular basis, you will realize that you do not need all of the metrics that are displayed by default. Also, you will probably need some extra reports that usually take a couple of extra clicks to access.
To avoid clutter, you can create custom reports that will contain only the information that you really need.
For example, if you usually only check where people come from, and how many unique visits have been generated from each country, you can create a custom report that will show you that specific information, and hide everything else that you do not need.
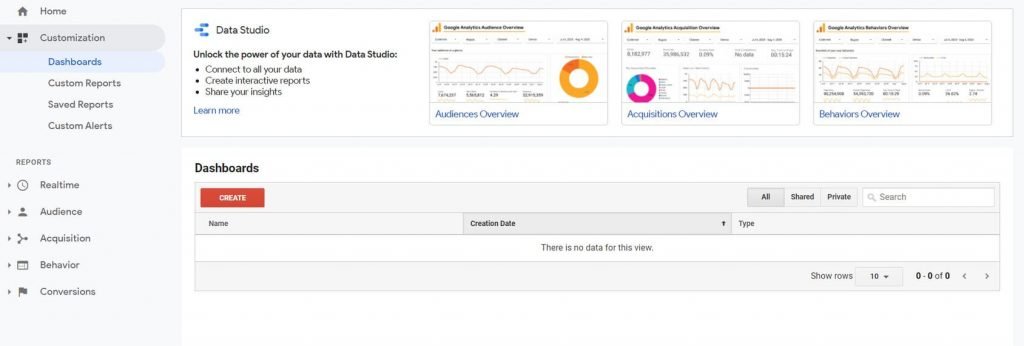
How to create a simple custom report in Google Analytics:
- Open your Google Analytics account.
- From the left-hand side menu, choose “Customization”.
- Click on “Custom Reports”.
- Choose “+ New Custom Report”.
- Name your report by adding the title.
- Choose metric groups that you want to show.
- Save changes.
Now, you will be able to open your custom report anytime to view only the metrics that you selected. If you need more custom reports, you can create as many as you wish, and customize them anytime.
Realtime reports
While most marketers and website owners need data that’s been accumulating for weeks and even months, there are times when they would like to see the users currently visiting their site. This is where the realtime report will help you and show you details about users who are currently active on your site.
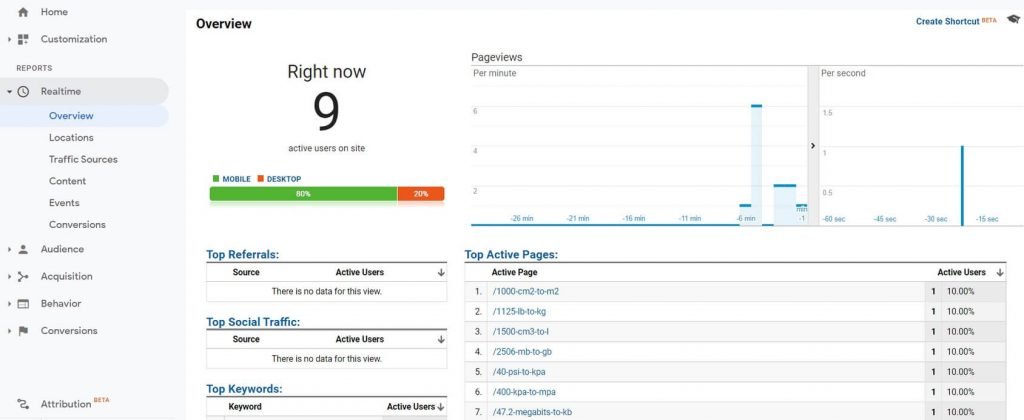
The realtime report will show you:
- Geographical locations – detailed graphs and an active map.
- Traffic sources – where the current users came from.
- Content – what pages are being opened, with their titles and URLs.
- Events – what events have been triggered by those users.
- Conversions – what goals have been achieved.
Audience
This report will offer you all of the information you need about the users and sessions on your site from the time you installed Google Analytics. Unlike the Realtime reports that show just the current users, you can filter the data to your needs, and change the time period for the report. This means that you can see how your users behaved in the last month or the last year, for example.
The Overview tab will show you the most important widgets that hold info about the number of users, sessions, bounce rates, countries they’re coming from, languages they’re using on their computers, and more.
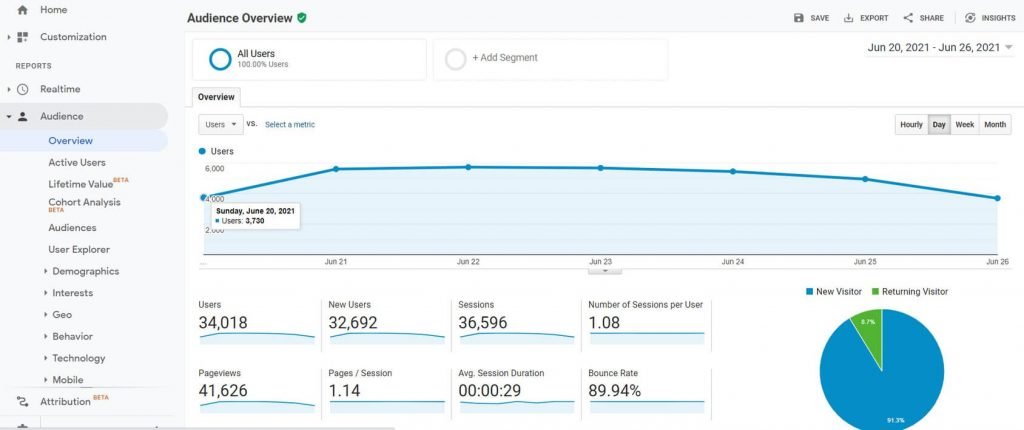
Here is a list of the key metrics that you need to know in order to be able to understand your daily Google Analytics reports. You have the option to view hourly, daily, weekly and monthly reports.

- Users – the number of people who visit your site.
- New Users – the number of people who have visited your site for the first time.
- Sessions – period of time a single user has spent on your site without leaving.
- Number of Sessions per User – how many sessions each user has had.
- Pageviews – the number of times a specific page has been viewed. If a single user visits a page a hundred times, each time counts as a new pageview.
- Pages / Session – the average number of pages viewed per one session.
- Avg. Session Duration – an average length of one session.
- Bounce Rate – the number of people who left your site after loading just one page.
If you move down the list, you will be able to access more info about:
- Active Users – users who have had at least one session in the given time period.
- Lifetime value – how much you have earned per user.
- Cohort Analysis – break down data into groups before analyzing.
- Audiences – all users and sessions.
- User Explorer – unique IDs that are assigned to specific user devices.
- Demographics – age and gender of the users.
- Interests – check the category a user belongs to such as shoppers, technology, media, beauty, etc.
- Geo – locations and language recognized on the device.
- Behaviour – how many users are new, how many returning, check their frequencies, and more.
- Technology – what operating systems, browsers, and networks the users are using.
- Mobile – check how many users have been accessing the site with desktop, mobile, and tablet devices.
- Cross Device – check to see if the same user has returned from a different device. You will need to activate Google signals for this feature to work.
- Benchmarking – monitor a specific report against the same report in a different time period to understand changes.
- User Flow – a detailed graph showing you how users navigate through your site.
How to detect the location of your website’s visitors in the last 30 days
No matter what kind of site you’re running, you will want to know where your visitors are coming from. That’s especially true if you’re selling something.
- Open your Google Analytics account.
- Navigate to Audience -> Geo -> Location.
- Click on the date in the upper-right corner of the screen.
- Change “Date Range” to “Last 30 Days”.
Acquisition
Find out more about how users found your site and navigated to it. There are differences between typing the URL in directly, finding a site via Google or other search engines, and those that come from other websites or social media.
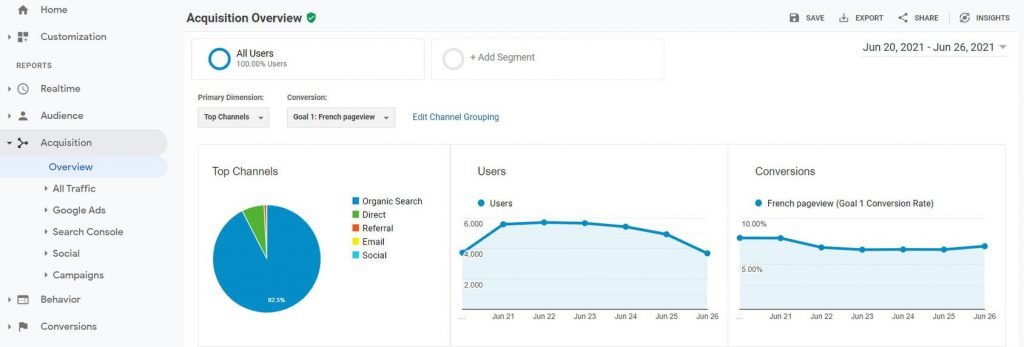
The acquisition report can also help you with details about Google Ads (if you’re using them, of course) as well as information from the Google Search Console if connected.
- All Traffic – view channels, treemaps, source/medium, and referrals.
- Google Ads – access the analytics for your Google Ads campaigns.
- Search Console – view landing pages, countries, devices, and specific keywords users have used to access your website.
- Social – get more info about users who came from social media sites.
- Campaigns – receive info about paid and organic keywords, as well as access to cost analysis.
How to check the number of visitors coming from Google
Google is the biggest search engine, so it’s important to know how many people have found your site through Google.
- Open your Google Analytics account.
- Go to Acquisition -> All Traffic -> Source/Medium.
- Click on Google/organic.
Behavior
Previously mentioned reports show you the details about your users and the way they came to your site. Now it’s time to learn more about the content, speed of your site, events, and more:
- Behavior Flow – access a detailed graph that will show you how users navigate through your website.
- Site Content – find out the most and least visited pages on your site.
- Site Speed – understand how well your pages behave in specific browsers.
- Site Search – discover how people are using the search on your site.
- Events – examine how many people triggered specific events you have created.
- Publisher – link AdSense or Ad Exchange with Google Analytics to get more info about impressions, clicks, and revenue.
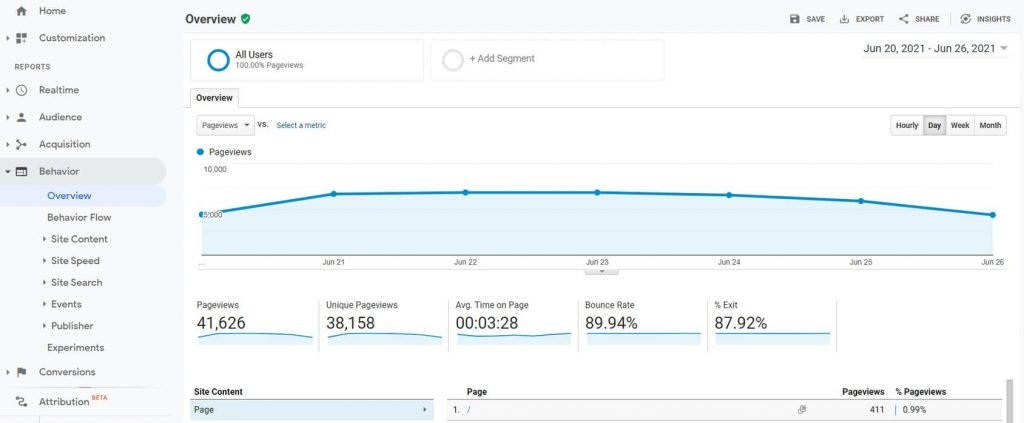
How to find out the most visited page on your site
In order to understand what your visitors want, you have to determine the most visited page on your site. This will enable you to improve the content and tailor it to your visitors’ needs.
- Go to your Google Analytics account and log in.
- Navigate to Behaviour -> Site Content -> All Pages.
- Click on the “Unique Pageviews” column to sort pages.
Conversions
When you open the Conversions report, you will understand what people actually do on your site.
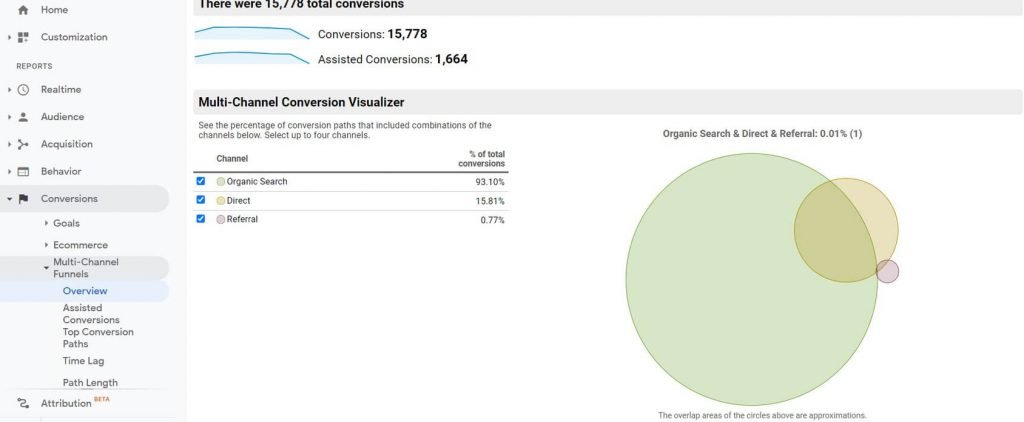
Conversions are actions that you want people to perform on your website. It consists of the following:
- Goals – shows you goals that you have achieved (and set up earlier).
- Ecommerce – needs to be set up separately. If so, it will show you how many transactions have been completed through your site/app.
- Multi-Channel Funnels – see the percentage of conversion paths that include combinations of the channels.
FAQs
Yes, Google Analytics is completely free for small businesses. You can use the service as much as you want, and connect up to one hundred sites to one account. However, if you need more in-depth analysis, you will have to consider upgrading to Google Analytics that has tier-based pricing.
Getting started with Google Analytics isn’t that hard. It will take you a couple of days to get acquainted with the system and to learn how to access the most basic reports. However, in order to get the most out of Google Analytics, you will need a lot of practice. Thankfully, Google offers free online courses through their Analytics Academy that will help you master the most popular measurement tools.
Google Analytics 4 is an upgrade to the popular Google service. It allows you to track your website and apps, either separately or together. This new system has the ability to track a single user through their entire journey, so you can better understand how each and every user behaves.
Setting up Google Analytics on mobile apps can be done in three steps:
Step 1: Enable app install tracking in your account.
Step 2: Update your Analytics SDK.
Step 3: Set up Custom Campaigns.
You can learn more about this on the official Google Analytics pages.
When you decide to share Google Analytics with someone, you do not have to take screenshots or record videos. You can quickly give them access, and all you need is their email address:
1. Login to your Google Analytics account.
2. Click the “Admin” link at the bottom-left corner.
3. Select “Account Access Management”.
4. Click on the blue plus icon on the top and select “Add Users”.
5. Type in the email address of the person you want to have access.
6. Click on the “Add” button.
In order to share a specific report with someone else, without giving them full access to your site, you will have to save a custom report. Once it’s saved, navigate to Customization -> Saved Reports, and select the report you want to share. Then, at the top of the screen, select the share icon, and write the email address of the person who should receive the custom report.
Conclusion
In this tutorial, I have covered the basic overview of the Google Analytics dashboard for beginners. It will allow you to easily get started and understand what Google Analytics is all about.
Although intimidating at first, Google Analytics is a powerful free tool that every website owner should have set up. No matter if you only track basic information about the number of people on your site, or need to analyze more complex details about events and conversions, Google Analytics is here to help.
The more you use it, it will become more natural, and it will help you to learn more about new analytical techniques each day.

Great insights in your latest post! I appreciate the way you broke down Google Analytics into simple, actionable steps. The section on setting up conversion tracking was particularly helpful—I didn’t realize how crucial it is for understanding user behavior and optimizing website performance. It’d be interesting to hear your thoughts on integrating Google Analytics with other marketing tools. Thanks for sharing your expertise—I’ll definitely be back for more tips and advice. Keep up the great work!
wonderful and so easy to learn article
Thanks for this information. I can now use Google Analytics to monitor my performance.
We’re glad that you find it useful. Good luck with your site!
Excellent overview! Well done.
Thanks a lot Alex!
This is so helpful. I have used Google Analytics in my company but only know the basics. This guide helped me to know it deeply in the sense, what exactly are each option and why is it for. Thank you so much!
You are so welcome Alphy! 🙂
Google Analytics is a wonderful tool but unfortunately quite often it’s not utilized to its full potential…
Feel free to check out our other how-to guides and articles – I’m sure you’ll find many other resources you can use 🙂
Very good.
There’s certainly a great deal to learn about this topic.
I llove all of the points you have made.
Yes Karthleen;
Even I have also searched a lot of Videos and sites for learning Google Analytics in an easy way, but this is the best article to learn.
Thanks to the First guide…