Website speed, or if you prefer a more technical term, web page loading speed is an important SEO factor. It’s also the main constituent of user experience. The attention span and patience levels of modern online content consumers are pretty low.
If your website is not loading fast enough, you risk losing that precious traffic. CDN (Content Delivery Network) can significantly speed up a website.
CDN providers deliver services able to accelerate any website despite the location of the server it’s hosted on.
Best CDN utilizes file cashing and does it on servers across the world. Website visitors don’t have to download content from servers across the planet. Instead, they get the content from the nearest server.
EDITORS’ CHOICE


Choosing the best one can be tricky because there are hundreds of CDN service providers out there. However, I can help you narrow down your research.
The top 16 most popular CDN services
Whether you are running a robust eCommerce website or a simple business portfolio website, the following top CDN providers will help you boost your website speed.
- G-Core Labs Truly global CDN
- KeyCDN Most affordable packages with free SSL
- CDN77 Free SSL and surprisingly easy to use
- CacheFly The fastest CDN network
- StackPath Great for beginners
- Cloudflare The best free plans in the CDN niche
- Google Cloud CDN Extremely powerful CDN
- Amazon CloudFront Highly customizable CDN
- Fastly Highly configurable platform
- MetaCDN A synergy of three networks
- Akamai The best option for tech-savvy experts
- Leaseweb CDN The best CDN for business users
- CDNsun A powerful CDN for big corporations
- Bunny CDN Cost-effective feature-rich CDN
- Limelight Great and balanced CDN
- Imperva Affordable CDN with intelligent caching
G-Core Labs — Fast delivery of any type of content

G-Core Labs CDN is one of the best in the world in terms of response speed according to Citrix UK’s independent analytical system.
G-Core Labs created its own global content delivery network on 5 continents to solve the difficult problem of instantly transmitting the heaviest type of content — high-quality online games, with peak loads on the system. After that company decided to benefit all companies interested in the instantaneous transfer of content, speeding up their websites and online stores, and their highly efficient protection.
G-Core Labs global CDN is ready for any peak traffic, the total network bandwidth exceeds 70+ Tbit/s. Its CDN has more than 120 points of presence, 6000+ peering partners, agreements with major operators, an ISP license, integrated DDoS & malware bot protection, 24/7 premium technical support in 5+ languages.
Key features
- Response times within 30ms worldwide, 3-5ms in select markets.
- More than 120 points of presence on 5 continents of the world.
- 6000+ peering partners and connections with all major telecom operators.
- WordPress CMS integration
- G-Core Labs CDN network capacity is 70+ Tbps
- Build-in cyber defense (against DDoS attacks, malware bots, etc.)
- 100% Uptime Guarantee
- Free CDN plan up to 1 000 Gb (overage is €0.0025 per GB)
- Free SSL
- Real-time analytics
- Highly customizable CDN
- User-friendly control panel
- Support for necessary protocols (HTTP/2, IPv6, TLS 1.3 with 0-RTT support, HLS)
- Premium technical support 24/7 via telephone, chat, e-mail (English, German, Chinese, Russian)
Pricing (14 days free trials are available)
- 1 TB – free
- 1.5 TB – starts at $37 per month
- 5 TB – starts at $105 per month
KeyCDN — The most affordable packages with free SSL
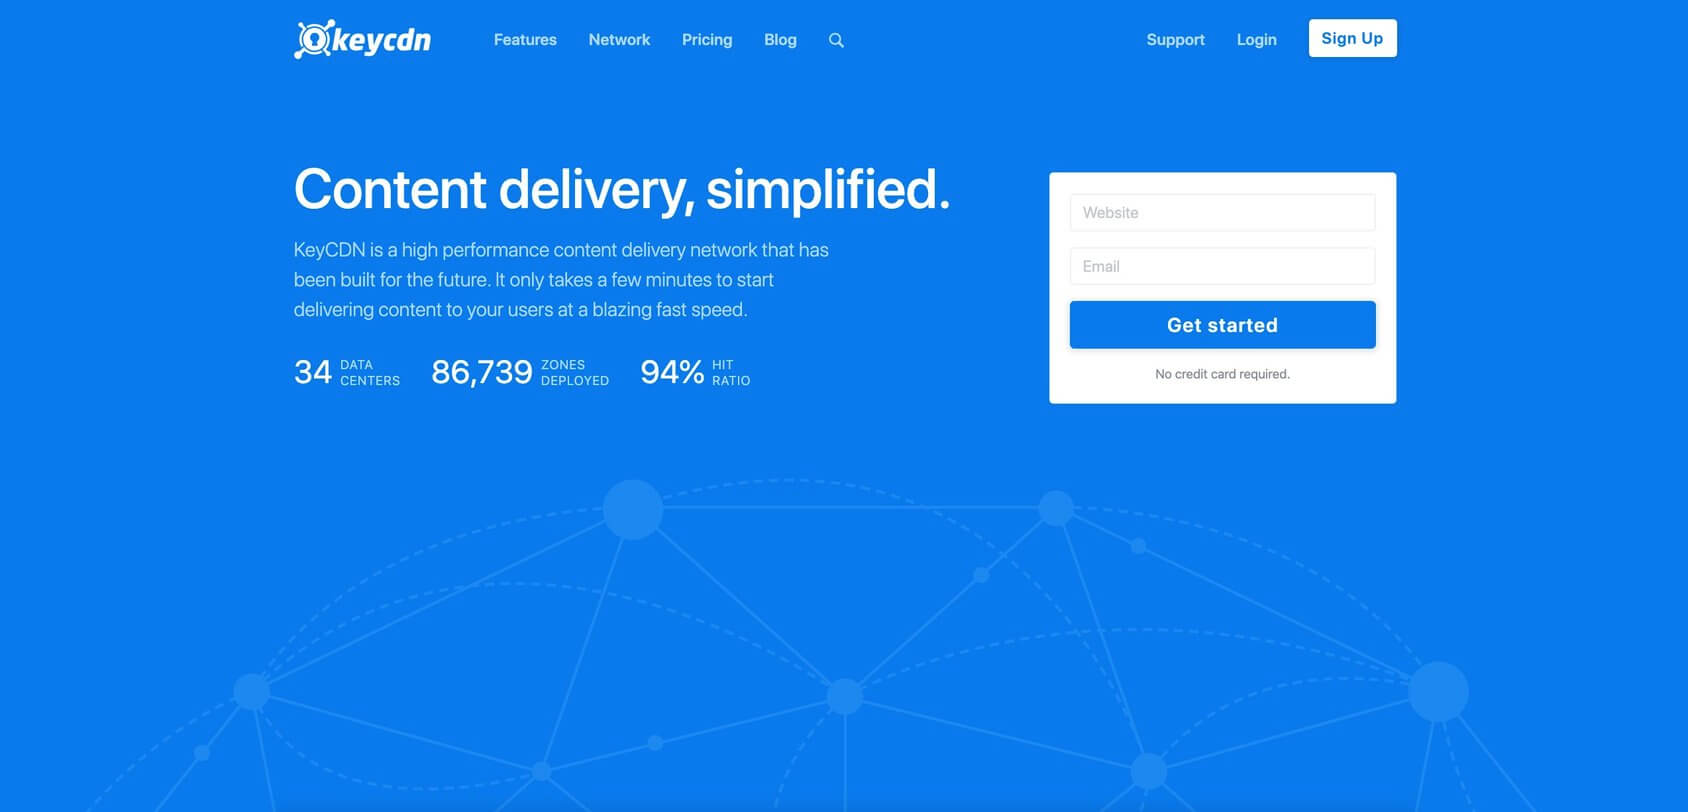
If you are looking for a budget CDN with a reliable and well-spread network, look no more, KeyCDN should be your go-to option. The affordable pricing plans are not the only reason you see KeyCDN on my list. It’s also user friendly. It comes with an intuitive and well-designed dashboard. Even users with a limited technical background can set it up and put it to use.
The provider also offers a few perks to advanced users. For instance, you have the autonomy to decide which CDN server to use as a source of updates to lighten the load of your server. Users can also set up custom robots.txt and manipulate strip and cache cookies.
Key features
- Support for HTTP/2 and IPv6
- Header control and zone alias
- GZip compression
- Image processing
- Real-time reports
- Additional security protocols
Pricing
- Pay for what you use model – users can enter their monthly outbound bandwidth to calculate their costs online
CDN77 — Free SSL and surprisingly easy to use
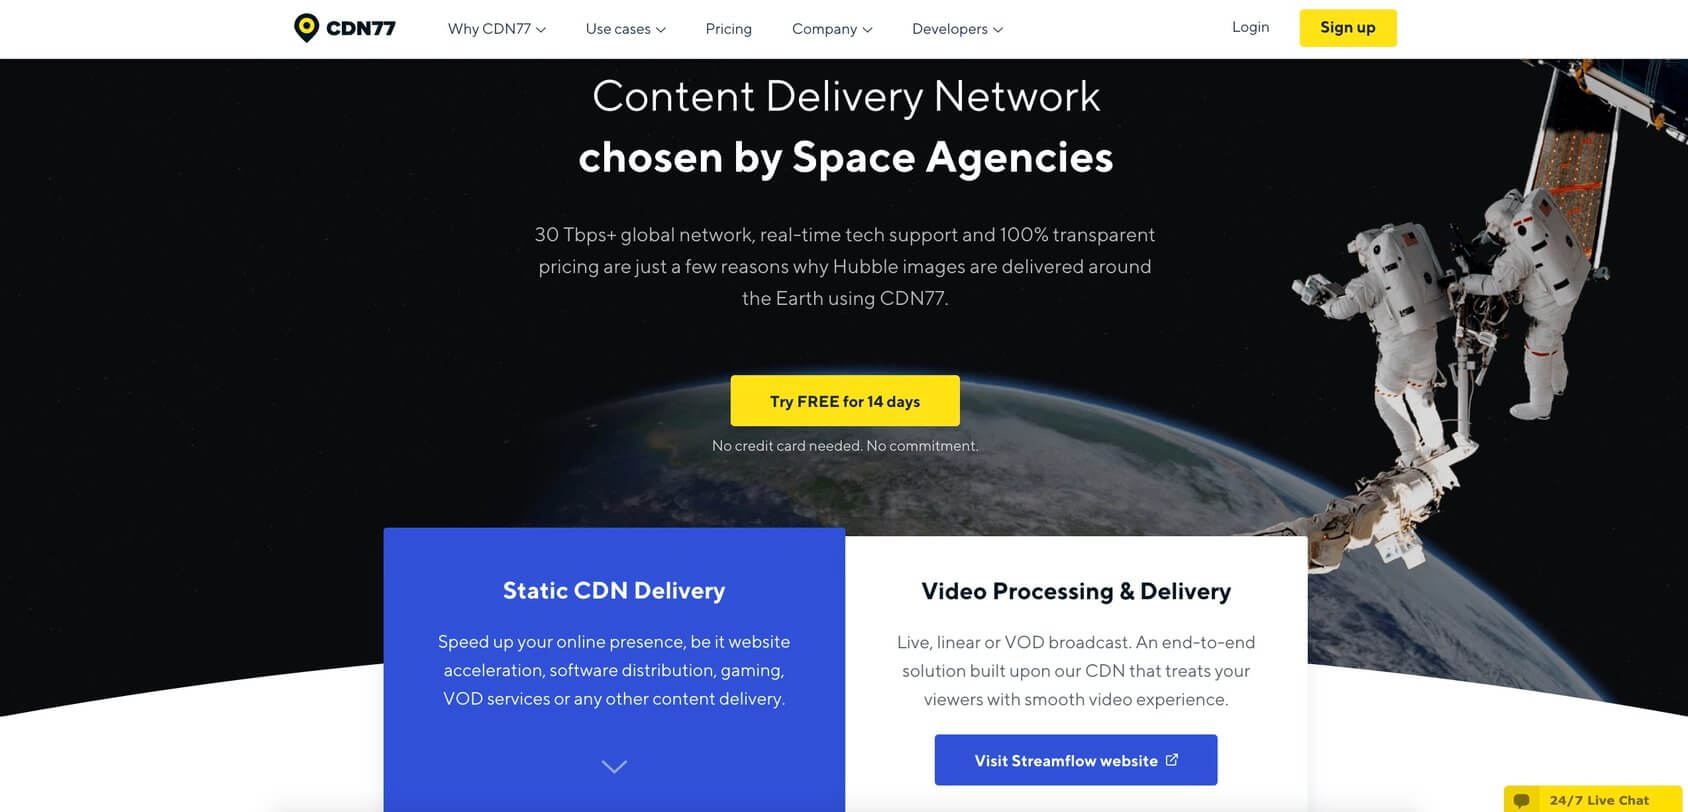
CDN77 is very similar to KeyCDN in terms of ease of use, affordability, and number of features. CDN77 has been on the market for quite a while. Its network includes 30 data centers located all over the world. Most of them are in the US and Europe, making this provider more focused on Western Nations. Although easy to use, CDN77 has some very impressive clientele, including the European Space Agency.
CDN77 dashboard is novice-friendly while still harboring some advanced settings for more tech-savvy users. The provider offers good value for money and throws in a free Let’s Encrypt SSL perk into every contract.
Key features
- Brotli and GZip support
- TLS 1.3 with O-RTT
- Support for HTTP/2
- CMS integration support
- Layered security solutions ranging from DDoS protection to Hotlink protection
- API
- Cache rules management
Pricing
- 6 TB – starts at $199 per month
- 25 TB – starts at $385 per month
- 50 TB – starts at $580 per month
- 100 TB – starts at $990 per month
- 150 TB – starts at $1,390 per month
CacheFly — The fastest CDN network
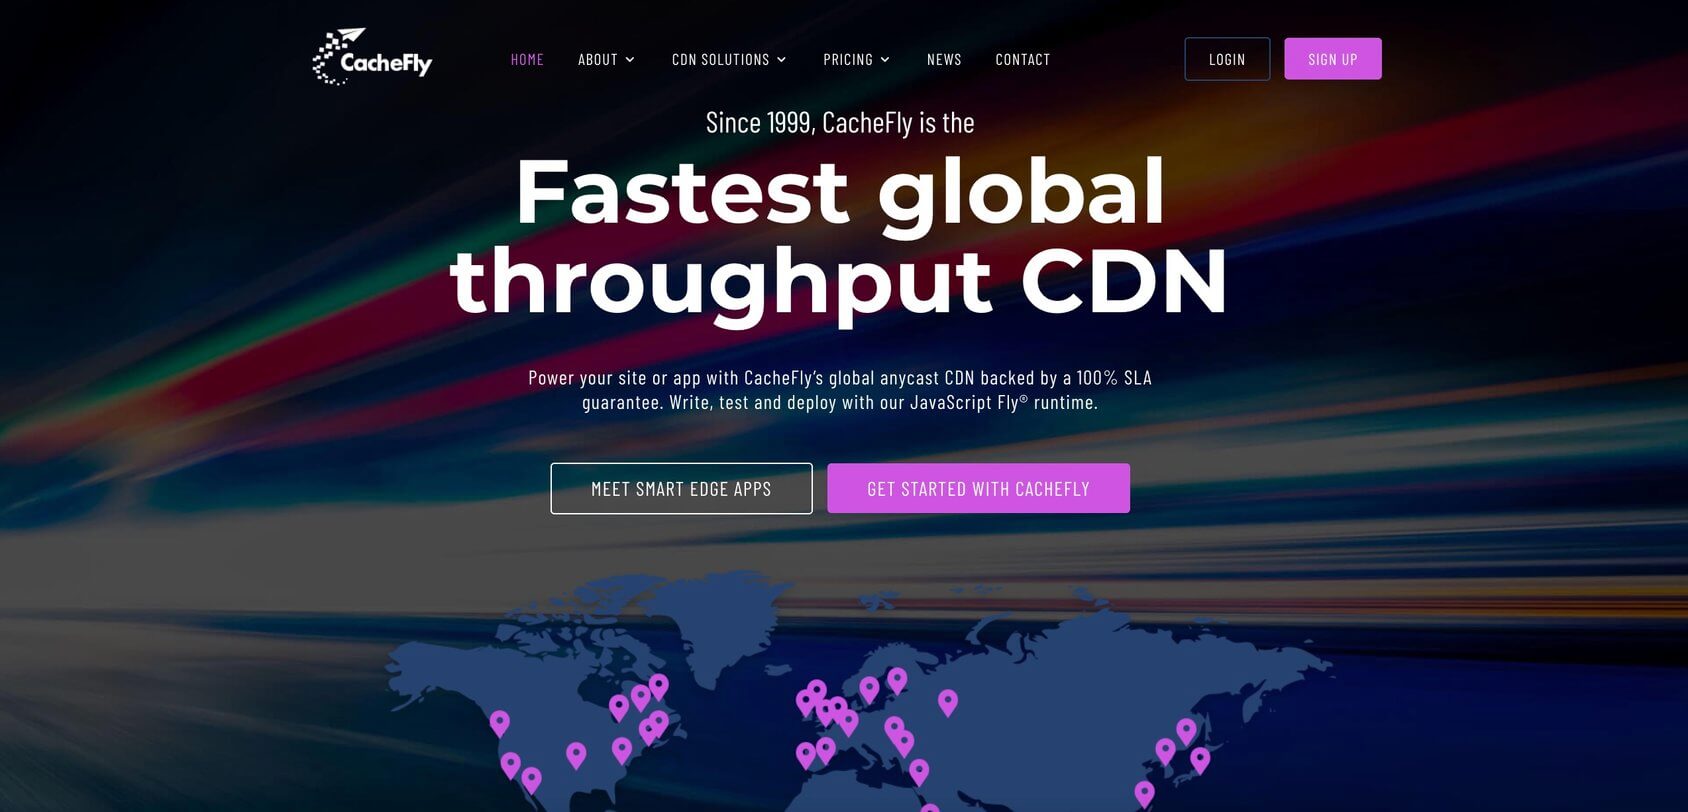
CacheFly CDN is one of the fastest CDN providers on the market. But this isn’t the only reason why
I added it to the best CDN list. It’s also the pioneer at adopting and using TCP anycast architecture, allowing it to assign single IP addresses to websites on a global scale.
While the CacheFly network is not as huge as Akamai’s, it’s optimized for ultra-fast speed and enhanced security. This provider has proved efficient at servicing websites from various niches ranging from podcasts and regular content delivery to smart edge apps and HD video streaming.
Key features
- Well-optimized network of servers with points of presence around the globe
- TCP anycast architecture
- HTTP/2 support
- Enhanced security
- Real-time reporting
Pricing
Contact CacheFly for pricing information.
Visit CacheFly for additional information >>StackPath — Great for beginners
StackPath is a relatively small operation. However, due to its reliability, tight security, ease of use, and focus on North American and European markets, it made it to my list. StackPath has only 32 points of presence – 14 in North America, 9 in Europe, 5 in Asia, 2 in Australia, and 2 in South America. The dashboard is simple and intuitive so that less experienced users can seamlessly use it.
The performance is consistent across North American and European servers. However, the output of other points of presence is somewhat worse. StackPath keeps security top-notch. It comes with DDoS protection, firewall, and Edge Rules to help you customize the service at all phases of the CDN request.
Key features
- A relatively small network of servers with a focus on western nations
- Intelligent caching and customizable caching rules
- Instant purge worldwide
- Real-time analytics
- GZip compression
- HTTP/2 and WebSocket support
Pricing
- Edge Delivery 20 – starts at $27.50 per month
- Edge Delivery 200 – starts at $200 per month
- Edge Delivery 2000 – starts at $2,000 per month
Note: ”Edge Delivery” are bundled services. If you want to use only CDN services, the pricing starts at $10 per month.
Visit StackPath for additional information >>Cloudflare — The best free plans in the CDN niche
Cloudflare is one of the leading USA-based CDN companies. The tactic to enable ease of use, but also offers advanced customization options, works in favor of Cloudflare. The users with no technical background can set up Cloudflare and start using it without having to write a single line of code. It’s as simple as updating DNS nameservers to use Cloudflare.
However, should you decide to take a look under the hub, you will be amazed. You can turn on bot filters, prevent content spam, benefit from layered security solutions, and even cushion the blow of DDoS attacks. What’s surprising is that Cloudflare delivers a free plan with no bandwidth limitations.
Key features
- Hundreds of servers placed in 200 cities and in over 95 countries
- API for advanced users who want to take full control of content caching and purging actions
- Support for static and dynamic content delivery
- Support for HTTP/3
- Intelligent traffic routing
- Support for CMAF, HLS, MPEG-DASH video files
Pricing
- Free – includes CDN services, DDoS protection, and email customer support
- Pro – starts at $25 per month
- Business – starts at $250 per month
- Enterprise – contact sales for pricing
Note: Cloudflare allows users to build their own service packets by adding/removing features.
Visit Cloudflare for additional information >>Google Cloud CDN — Extremely powerful CDN
If anyone has globally distributed points of presence, then it’s Google. Google Cloud CDN leverages the company’s presence to deliver one of the fastest and most optimized CDNs on the market. Google Cloud CDN proved efficient and reliable at video and web content delivery on all continents.
The company achieves great connectivity by peering edge caches with almost all major end-user ISP. Cloud CDN also assigns a unique single global IP address to your website, delivering consistent performance across desktop and mobile devices. Google’s CDN is integrated with Google Cloud so that users can benefit from powerful reports, real-time monitoring, and industry-grade online security.
Key features
- Anycast architecture
- Support for hybrid and multi-cloud architectures
- Support for HTTP/2 and QUIC
- Free TLS (SSL) certificates
- Integrated with Google Cloud
Pricing
- Google Cloud CDN features the “pay as you go” pricing model. You will be charged for bandwidth, HTTP/HTTPS requests, cache egress bandwidth, and cache misses. Visit Google Cloud CDN official webpage to view pricing details.
Amazon CloudFront — Highly customizable CDN
Amazon CloudFront is one of the services Amazon offers through its Amazon Web Services platform. Amazon’s CDN service is reliable and fast. Thanks to cutting edge technologies and strategically placed servers across the globe, Amazon is able to deliver good speeds to end-users.
The platform can be used without messing around with settings. However, for optimal results, a setup is recommended. There is even support for automatic GZip compression and in-depth analytics. Bear in mind that Amazon doesn’t offer free tech support with its services.
Key features
- A global network of 216 points spread across 42 countries
- Great security (AWS Shield, AWS Web Application Firewall, AmazonRoute 53, HTTPS, SSL/TLS)
- The origin redundancy allows you to serve content even when the primary origin is offline
- Support for HTTP and WebSocket protocols
- Full-featured API
Pricing
- Free tier – 12 months free, 2 million HTTP or HTTPS requests per month, 50 GB of data transfer
- On-demand – Amazon custom-tailors pricing plans for each customer
Fastly — Highly configurable platform
Fastly belongs to the heavyweight CDN category. It’s a robust platform with a lot of configuration options. The settings will even enable you to choose preferred methods for video caching, customize HTTP headers, and more. The dashboard can easily confuse novice users, which is why Fastly is recommended CDN for tech-savvy people.
Fastly delivers the state of the art optimization and fast speeds, which is why some of the biggest websites use it, including Reddit and Spotify. Considering the number of features, pricing, and free trial, it’s one of the more affordable CDN providers on the market.
Key features
- Solid-state drive powered servers strategically placed in over 40 cities on all continents
- Access to API for better optimization
- Support for HTTP/1.1, 2, 3, QUIC, TLS 1.0, 1.1, 1.2, and 1.3
- Extensive customer support including knowledge base and live chat
Pricing
- Free trial for up to $50 of traffic
- Completely customizable pricing plan – users have access to an online pricing calculator
MetaCDN — A synergy of three networks
MetaCDN is an Australian-based service provider. It leverages the power of several best CDN providers to guarantee fast loading speeds and minimize downtimes to its clients. MetaCDN uses the services of Fastly, Amazon CloudFront, and Verizon EdgeCast. Thanks to this approach, MetaCDN covers the entire globe increasing the chances that every user will have a server nearby.
When it comes to performance, this provider is one of the best. The servers are set up to automatically choose the optimal server for a user. For instance, Fastly delivers lightning-fast speeds to UK users. If a page request originates from a UK-based IP address, MetaCDN will serve content from one of the UK servers in Fastly’s network.
Key features
- Three top CDNs brought together under one roof
- Consistent performance due to several redundant backup systems
- Powerful analytics and reports
- 100% uptime guarantee
Pricing
- Free trial, no credit card required
- Basic – starts at $20 per month
- Lite – starts at $50 per month
- Pro – starts at $100 per month
Note: Yearly subscription plans are also available at a 20% discount
Visit MetaCDN for additional information >>Akamai — The best option for tech-savvy experts

Akamai has an impressive network of servers. It’s one of the oldest CDN companies on the market. Its network currently consists of over 275,000 servers located in over 130 countries. The provider serves up to 30% of all internet traffic. The powerful features, great customer support, and lots of customization settings render this provider a favorite pick among professionals.
The dashboard is intuitive yet complex. Simply put, Akamai caters to the need to teach savvy experts, so they have a robust interface and many customization options. The services are paired with great customer support available around the clock.
Key features
- Large CDN coverage
- Cloud security including DDoS protection
- Completely customizable CDN service
- Extensive support for IP video
Pricing
- 6 TB plan- $400
- 25 TB plan- $1000
- 50TB plan- $1700
- 100TB plan- $2500
Leaseweb CDN — The best CDN for business users
Leaseweb CDN is more focused on business than individual users. That approach is reflected in the provider’s pricing plan, and the number of CDN and security features available. Even the basic plan comes with an extensive list of features making this provider a go-to source for business CDN solution. The CDN console is well-designed to enable easy CDN management and customization.
Leaseweb CDN comes with many CDN tweaking opportunities. For instance, you are even able to set the time for 404 responses caching or customize the cache-control header. Since it caters to business needs, Leaseweb CDN offers a free 30-day trial.
Key features
- Choose between Multi-CDN or private CDN
- Enterprise-grade online security
- Deep-customization options
- Complete control of CDN, traffic, and caching
Pricing
- Leaseweb CDN doesn’t have a pricing plan on the official website. Contact them via live chat or email to get a quote.
CDNsun — A powerful CDN for big corporations
CNDsun is a Czech-based CDN provider catering to the needs of people on a budget. CDNsun manages a small network of data centers. It currently encompasses servers in over 70 locations, including North and South America, Europe, and Oceania. Thanks to a well-optimized network, CDNsun is efficient at origin pulling and live video streaming both from CDNsun and your servers.
The company also provides a free custom Let’s Encrypt SSL. The user interface is not overly complex. There are both novice-friendly and advanced settings. Among other things, you can manage cookies, and query strings, set up your port and origin protocol, expiry date, and more.
Key features
- The network consists of 50 points of presence in 50 locations across 5 continents
- Support for HTTP/2
- RTMP, Live, and Live Event streaming
Pricing
- “Pay as you go” pricing model – no monthly commitments, consumers pay per spent GB. The pricing plans are based on the minimum traffic spent monthly. Visit the official website and use the calculator to see the estimated costs.
Bunny CDN — Cost-effective feature-rich CDN
Bunny CDN is a Slovenia-based CDN service provider. It’s a small operation, but it’s kept tight and optimized for great speed. The providers specialize in delivering several services, including web app distribution, video delivery, cloud storage, and worldwide server locations. Bunny CDN infrastructure currently supports over 50,000 pull zones.
The provider offers a free SSL certificate. The dashboard is easy to use, making the Bunny CDN an excellent option for first-time CDN users. There are also several security features. Users can also create and manage different pull zones.
Key features
- The network consists of 39 servers located on six continents (most of the servers are in North America, Europe, and Asia)
- IP block and blacklist
- User permission rights
- Real-time monitoring and reports
- Support for video delivery
- Query API, image optimization, CSS, and JS minification
Pricing
- Standard tier (40 PoPs) – Europe and North America $0.01/GB, Asia, and Oceania $0.03/GB, South America $0.045/GB, South Africa $0.06/GB
- Volume tier (7 PoPs) – First 500TB $0.005/GB, From 500tb-1PB $0.004/GB, From 1PB-2PB $0.002/GB, From 2PB+ Contact sales for pricing
Note: BunnyCDN offers an online price calculator to estimate your monthly CDN bill.
Visit Bunny CDN for additional information >>Limelight — Great and balanced CDN
Limelight is a small operation. However, the company CDN is kept tight. Limelight promises great speeds and 100% uptime. The provider’s servers are spread all over the world to ensure loading speed consistency. The CDN is not only optimized for delivering content usually found on websites, but also video and audio files and software.
Feature-wise, Limelight is a good option. More importantly, it comes with one of the best UIs on the market. Intelligent purging, DNS service, and security make Limelight a very popular option to newbie CDN users who want the biggest bang for their buck.
Key features
- The network consists of 130 servers located in over 45 cities across the globe
- HTTP./2 support
- Optimized storage performance
- Access to Limelight Configuration API
- Secure and fast delivery of query responses
- SmartPurge and a variety of purge options
Pricing
- Limelight CDN doesn’t have a pricing plan on the official website. If you are interested in using the company’s services feel free to contact them directly.
Imperva — Affordable CDN with intelligent caching
When a data and application security company develops a CDN, it’s logical to have high expectations. Imperva is a great CDN performance and security-wise. It’s more suited for businesses and enterprises than personal use.
Imperva dashboard UI is designed according to industry standards. Onboarding should not be hard, but advanced features should definitely be left to professionals. Most of the features are locked behind paid plans. There is also a free plan you can use to test the overall performance.
Key features
- Big content delivery network
- Cache management and intelligent cache control
- Content and networking optimization
- HTTP/2 and IPv6 support
- Bot protection
- Firewall, DDoS protection, 2FA
Pricing
- Free plan – no SSL support, no purge cache, no tech support
- Pro plan – starts at $59 per month
- Business plan – starts at $299 per month
- Enterprise plan- Contact sales for pracing
How to choose the right CDN provider
Looking at the best CDNs list can help you narrow down your options. You should keep in mind though that the best content delivery network is not at the same time the right content delivery network provider for you. As you could see, all providers are different. They have points of presence in different cities, countries, and continents, use different technologies and architecture, and implement a variety of security solutions.
You also have to make a decision whether to go with a free CDN or a paid one. The bottom line is – choosing the right provider is not easy. Apart from knowing the offer inside and out, you have to know how to pair CDN features with your unique business, website, and visitors’ needs. Here are the most important things to check when choosing the right CDN provider.
The locations of points of presence
You know your visitors the best. Use website traffic analytics to discover geolocation your visitors are coming from. The right CDN companies should have PoPs in those locations or at least nearby.
Network connectivity
Network connectivity is measured by good response times, no packet losses, and low latency. Either use a free trial or dig a little deeper through customer reviews to learn about the CDN provider’s network connectivity profile.
Wait times vs DNS response times
To achieve a lightning-fast speed, you need fast wait times and fast DNS response times. However, some CDN providers have complex DNS setups due to questionable practices and fast-growing networks. It can significantly slow down DNS response times. Always make sure that CDN can serve your content faster than your original server, or so-called Origin.
Delivery speed of small files and larger payload
Some providers are better at serving small files, while others are better at serving larger payloads. The top CDN providers are good at both. Test booth uses before you make your final decision.
Cache hit/miss ratio
Last but not least, take a close look at the cache hit/miss ratio. If your CDN has to go back to the origin to get the content too often, you won’t benefit from using a CDN. The bigger the ratio, the better. Some of the best CDN providers have it above 95%.
Best of the best
If choosing the right CDN sounds too complicated for you, don’t worry, I got your back. Below you will find the best of the best CDN providers classified in use-case categories.
Best cheap CDN
The best and free CDN doesn’t go in one sentence. If you are running on a budget but still want to improve the loading speed of your web pages, the following two providers can help you do it in a cost-efficient way.
Best CDN for WordPress
Are you running a WordPress website? There are a couple of the best CDN providers with a specific focus on WordPress users. You won’t make a mistake whether you decide to go with a Cloudflare or CDN77 as they are both easy to integrate into a WP.
Best CDN for images
Optimizing a website heavy on images for speed is a real mind cracker. Sirv and Optimole are providers that will help you deliver high-quality images to your end users at lightning-fast speeds.
Best CDN for video streaming
Loading speed optimization for websites with video streaming is a real challenge, especially for live streams and on sites with heavy traffic. When it comes to the best content delivery network for video streaming, it doesn’t get better than with Akamai and Limelight.
FAQs
CDN stands for “content delivery network”. The network consists of servers distributed across continents. Its primary role is to deliver online content to end-users. Once a user sends a request, the content delivery network caches it and serves the user with content from the nearest server.
The content doesn’t only include videos and images but also HTML, JS, and CSS code. The ultimate purpose of a CDN is to reduce DNS response and wait times and to increase web page loading speed.
Not all websites need a CDN. There are several telltale signs that your website would need a CDN. Look at the geographical signature of your website traffic. If your website visitors come from all over the world, using a CDN will significantly reduce web pages load times.
If you notice sudden spikes in your website traffic, it’s another sign that you can benefit from a CDN. A CDN will serve cached pages taking a huge load from the origin server and preventing potential crashes. It is also a good option if your website is a target of bots and cybercriminals because it comes with several security layers to protect your content and the Origin server.
To use a CDN, you first have to choose a provider and register on the official CDN website. Then you have to add the website you want to use CDN for. Once you are done with it, you will have to confirm and configure your DNS records.
The providers will provide you with new nameservers. Once you have them, go to DNS records in cPanel and update them using new nameservers. From that point on, CDN will cache your website and serve the content from the servers on the CDN. Bear in mind that this process will be different for each provider. Consult technical documentation and guides to properly use a CDN you invest in.
CDN costs may warry. There are few free CDN services on the market, but they are often limited by either the number of requests or bandwidth or both. CDN providers usually have two pricing models. The first one is based on subscription plans.
The second pricing model is “pay as you go” meaning that you will pay for used bandwidth and the number of requests. Some providers will also charge you for cache misses such as Google Cloud CDN.
Getting your content stored on servers across the world sounds like a risky endeavor. However, the top CDN providers keep your security tight. Their servers are locked behind several layers of industry-grade online security solutions, such as encryption. Your content will be safe.
On top of that, many providers have DDoS protection enabled to keep attackers at bay.
Conclusion
All 15 best CDN providers I listed are trustworthy and reliable companies with a longstanding reputation in the world of CDN. You’ve probably noticed that although they offer the same CDN service, they are still quite different. They use different technologies, offer unique dashboard UIs, and come with different features. If you have problems deciding which one to use, go back to my “The Best of the Best” section, where you can find the best CDN for your specific use case scenario.