Big Data Statistics 2023: How Much Data is in The World?

You’ve probably noticed that the term “big data” is frequently used these days. That’s because big data is a major player in the digital age. This term refers to complex and massive data sets that far exceed the potential of traditional data processing applications.
In the online business realm, digital businesses use the term big data to refer to data processing methods, such as predictive analytics, that allow them to extract value from gathering and analyzing online data.
However, for a digital company to harness the power of big data, they need to rely on three key factors: high-end analytics skills, unprecedented processing power, and secure storage capacities.
Since big data plays such a crucial role in the modern business landscape, let’s examine some of the most important big data statistics to determine its ever-increasing importance.
Top 10 Big Data Statistics
- Global big data analytics market annual revenue is estimated to reach $68.09 billion by 2025.
- By 2022, the big data market will grow to $274.3 billion.
- There were 79 zettabytes of data generated worldwide in 2021.
- 90% of the data in the global datasphere is replicated data.
- Global IoT connections already generated 13.6 zettabytes of data in 2019 alone.
- By 2025, more than 150 zettabytes of big data will need analysis.
- In 2021, there was 24% of big data revenue in software, 16% in hardware, and another 24% in services.
- The COVID-19 pandemic increased the rate of data breaches by more than 400%.
- By 2027, the use of big data application database solutions and analytics is predicted to grow to $12 billion.
- Between 2021 and 2022, the worth of the big data market is estimated to jump $30 billion in value.
General overview of big data statistics and facts
Here are some of the most important big data stats and figures to draw a clearer picture of how much data there is currently in the world.
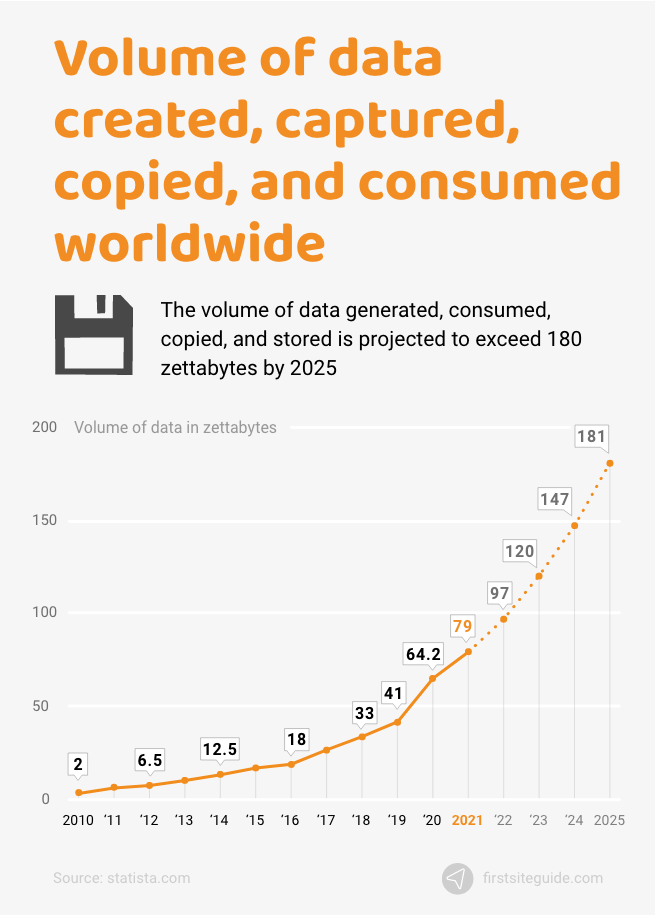
1. In 2021, the overall amount of data generated in the world was estimated to be around 79 zettabytes.
In 2021, it was forecast that the overall amount of data created worldwide would reach 79 zettabytes. By 2025, this amount is expected to double. Of all of the data in the world at the moment, approximately 90% of it is replicated data, with only 10% being genuine, new data.
(Source: Statista.com)
2. Amount of data/information generated, gathered, copied, and consumed to reach 180 zettabytes by 2025.
The volume of data generated, consumed, copied, and stored is projected to reach more than 180 zettabytes by 2025. In 2020, the total amount of data generated and consumed was 64.2 zettabytes.
The COVID-19 pandemic brought a rapid increase in global data creation in 2020, as most of the world population had to work from home and used the internet for both work and entertainment.
(Source: Statista.com)
3. There is 10% unique and 90 % replicated data in the global datasphere.
There is 90% replicated data in the global datasphere, with only 10% being unique data. Between 2020 and 2024, the unique/replicated data ratio is projected to change from 1:9 to 1:10.
(Source: Statista.com)
4. More than 65 billion messages are being exchanged daily via WhatsApp.
WhatsApp users exchange more than 65 billion messages every day. The app connects more than 1 billion groups, and its users complete over 55 million video calls daily.
(Source: Mybasis.com)
5. It would take an internet user approximately 181 million years to download all data from the web today.
If someone were to download all of the data from the internet today, it would take them around 181 million years to do it. Internet users spent approximately 2.8 million years online in 2018 alone. There are more than 2.5 quintillion bytes of data being generated each day.
(Source: Unicorn-insights.com)
6. Between 2010 and 2020, data interactions increased by 5000%.
In the last eleven years, the volume of data generated, harvested, copied, and consumed worldwide grew by almost 5000%. The main result is a significant increase in data usage that went from 1.2 trillion gigabytes to 59 trillion gigabytes.
(Source: Forbes.com)
7. Every internet user created 1.7 megabytes per second in 2020.
There’s no stopping data growth, and the best example of this ongoing explosion of data is the fact that there were 40 zettabytes of data created in 2020 alone. That’s roughly 1.7 megabytes of data generated per second for every internet user in the world.
(Source: Ibm.com)
8. 80–90% of the data that internet users generate daily is unstructured.
Modern internet users have many different ways to interact with the internet. They can use email, tablet, mobile device, or PC to go about their daily business. Because of this, all data generated by internet users comes in different forms and is unstructured.
(Source: Cio.com)
Overview of data analytics stats and facts
Let’s delve deeper into the latest data analytics stats and figures to give you a better idea of the importance of data analytics in the internet-driven business environment.
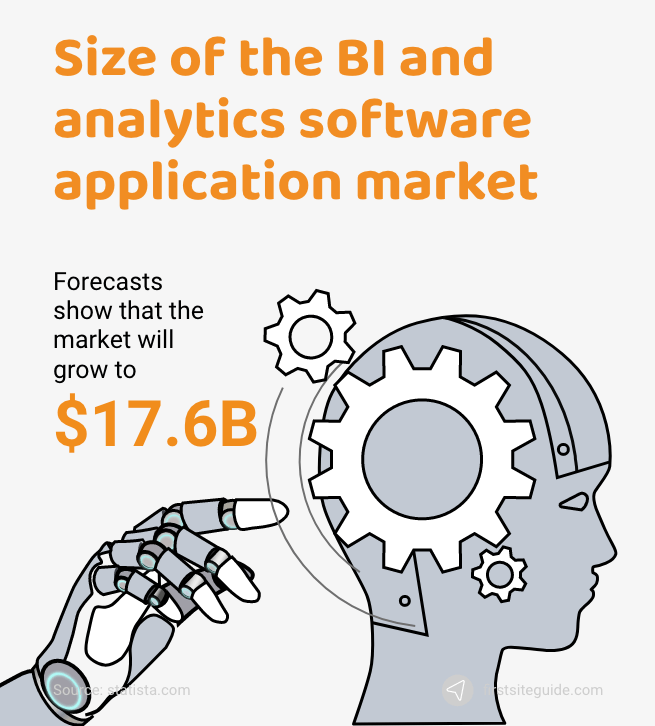
9. The worldwide market size of BI & analytics software applications could reach $17.6 billion by 2024.
The market size for data analytics and business intelligence software applications is projected to grow over the next few years. Forecasts show that the market will grow from $14.9 billion to $17.6 billion in 2024. This market is also called the enterprise application software market, with worldwide revenues estimated at $210 billion in 2019 alone.
(Source: Statista.com)
10. The worldwide big data analytics market could reach $68 billion by 2025.
In 2019, the global big data analytics market revenue was around $15 billion. Since the market has achieved a compound annual growth rate of almost 30%, it is estimated that the market revenue will reach over $68 billion by 2025.
(Source: Statista.com)
11. The healthcare big data analytics market could reach $67.82 billion by 2025.
According to the Allied Market Research report, the global healthcare big data analytics market is expected to reach the $67.82 billion mark by 2025. In 2017, this market was valued at only $16.87 billion, achieving a 19.1% CAGR in less than five years.
(Source: Globenewswire.com)
12. 45% of enterprises all over the world are using the cloud for running one or more big data workloads.
Both the cloud and AI are still disrupting the digital business markets. In 2019, almost half of all new big data workloads ran in the cloud. If the latest reports are any indication, more than 45% of modern businesses worldwide are relying on the cloud to run their big data workloads.
(Source: Zdnet.com)
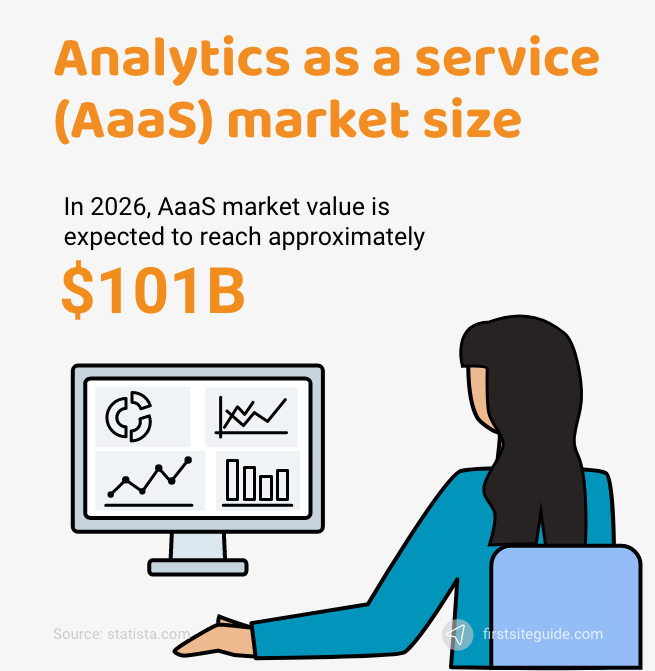
13. Global Analytics as a Service (AaaS) market is expected to reach $101 billion by 2026.
AaaS stands for analytics as a service and refers to all analytics software and business operations that take place over the internet. This business service model allows the user to only pay for what they use.
AaaS is expected to become one of the most popular service models used by many industries. In 2026, the value of the global AaaS market is projected to reach approximately $101 billion.
(Source: Statista.com)
14. Global marketing-related data market is projected to reach $52.62 billion by 2021.
The value of the marketing data market worldwide was $34.61 billion in 2019. It is expected to reach 52.62 billion by 2021.
(Source: Statista.com)
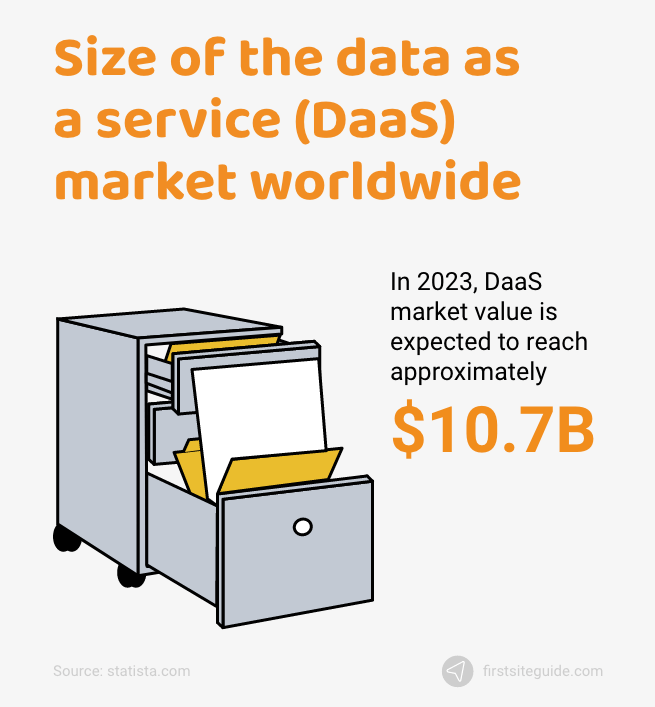
15. Global DaaS market could reach $10.7 billion by 2023.
DaaS stands for data as a service and refers to the utilization of cloud computing to deliver data-related services such as processing, integration, storage, and more. DaaS has become extremely important in the last few years.
Because of this development, the global DaaS market is projected to achieve steady growth in the future. The market’s revenue growth is expected to reach $10.7 billion by 2023.
(Source: Statista.com)
Corporate big data statistics and facts
Corporate big data statistics can help us to understand how modern companies use big data today and how it can benefit their operations. Below, we will list the largest and leading vendors in the global big data market and more.
16. Microsoft is the largest vendor in the worldwide big data and analytics software market with a 12.8% market share.
By examining the statistics showing the vendors with the largest market share worldwide from 2014 to 2019, we can see significant growth. In 2019, Microsoft became the largest global big data market vendor with a 12.8% share.
(Source: Statista.com)
17. Informatica is the leading vendor in the global big data analytics and integration software market.
In 2019, the global revenue from the big data analytics and integration software market was approximately $3.37 billion. Between 2014–2019, the market achieved steady growth, with Informatica being the leading vendor in the market.
(Source: Statista.com)
18. SAS is the vendor with the biggest market share in the global advanced and predictive analytics software market.
Between 2014 and 2019, SAS achieved the biggest share of the global enterprise analytics software market. The company’s market share was 27.9%.
(Source: Statista.com)
19. SAS has the largest market share in the global analytic data integration software market.
SAS has accumulated $517 million in revenue from the analytic data integration software market in 2019 alone. In 2019, the company’s analytic data integration software market share was 15.3%.
(Source: Statista.com)
Cloud computing and big data centers statistics
Cloud computing is the most effective way for companies to deal with the ever-increasing volumes of data needed for big data analytics. Cloud computing allows modern enterprises to harvest and process large amounts of data.
More importantly, the cloud allows companies to tap into powerful computing capacity and store their data in on-demand storage to make it more secure and easily accessible.
Businesses can keep their data in data centers to easily query and view colossal data sets in a cost-effective and timely manner. Let’s examine the essential cloud computing and data center statistics for 2021.
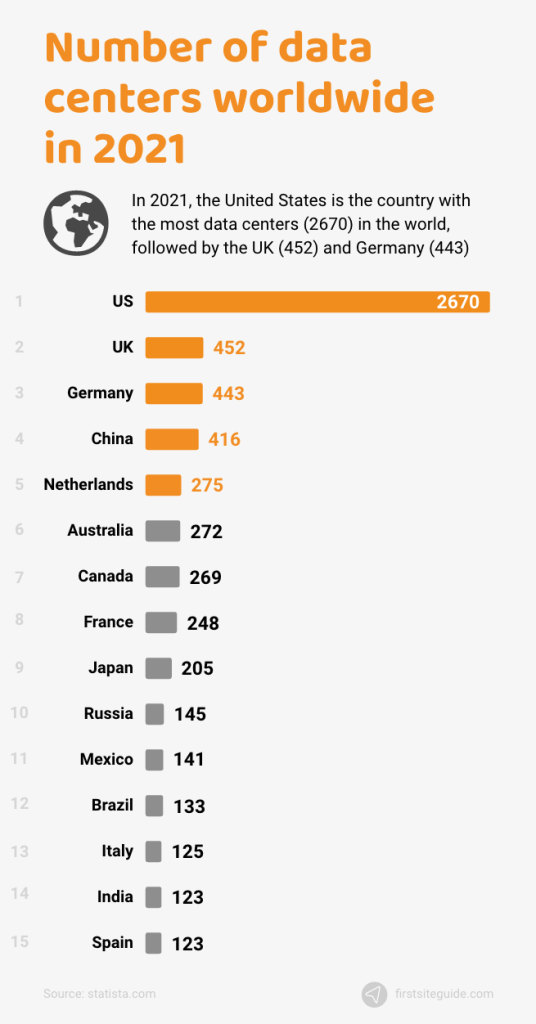
20. In 2021, the US is the country with the most data centers (2670) in the world.
In 2021, the United States is the country with the most data centers (2670) in the world, followed closely by the UK (452) and Germany (443).
(Source: Statista.com)
21. The installed base of data storage capacity in the global datasphere could reach 8.9 zettabytes by 2024.
The total installed global data storage capacity base is projected to grow steadily through 2024. The total installed base will increase from 6.8 zettabytes (2020) to approximately 13.2 zettabytes (2024). The total amount of data in utilized storage is expected to reach 8.9 zettabytes by 2024.
(Source: Statista.com)
22. Microsoft Azure was the leading provider of cloud business intelligence in 2021.
As of 2021, the leading provider of cloud business intelligence is Microsoft Azure, with 69% of the market share. This company is closely followed by Amazon Web Services (55%), Google Cloud (53.5%), and Oracle Cloud (33.5%).
(Source: Statista.com)
23. Hybrid Cloud was the most preferred global business cloud strategy from 2017-2020.
As of late 2020, a hybrid cloud – a business solution that merges private and public clouds – was the most preferred global business cloud strategy, with 82% of businesses deploying the solution.
(Source: Statista.com)
24. In 2020, businesses spent $129.5 billion on cloud infrastructure services and data centers.
In 2020, corporate spending on data centers and cloud infrastructure services, such as the latest databases, storage, and networking solutions, reached the $129.5 billion mark. That’s more than 34% more than 2019 spending.
(Source: Statista.com)
25. IT data center systems total global spending could increase by 9.7% from 2020.
In 2021, corporations spent around $196 billion on IT data center solutions. Enterprise spending on IT data center systems increased by 9.7% from 2020.
(Source: Statista.com)
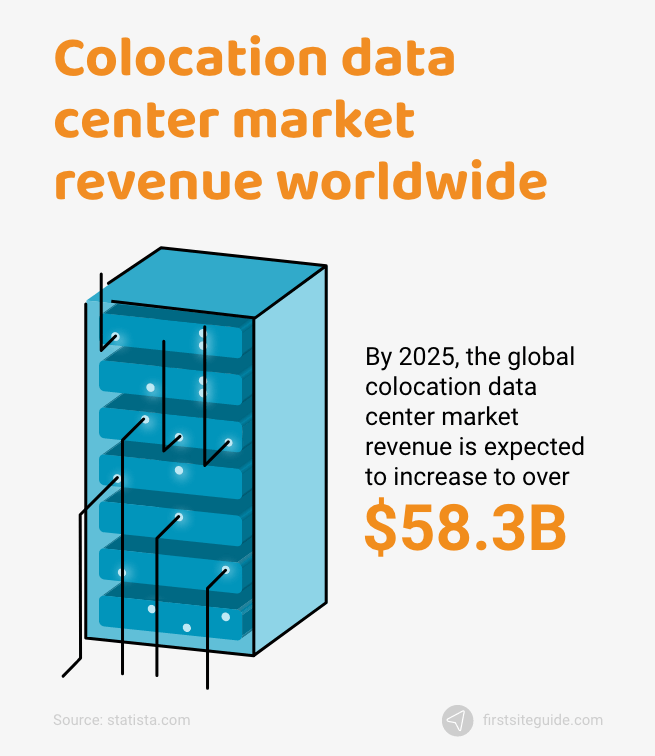
26. Global colocation data center market revenue could increase to more than $58 billion by 2025.
The term “datacenter colocation” refers to large data centers that power cloud computing resources to provide enterprises with networking connections, power, security, and data storage.
In 2019, enterprises spent around $31.39 billion on data center colocations. By 2025, the global colocation data center market revenue is expected to increase to more than $58 billion.
(Source: Statista.com)
27. In 2021, cloud business intelligence was critical to the operations of 27.5% of businesses.
In 2021, a large segment of retail and marketing businesses (27.5%) stated that cloud business intelligence was critical to their operations. Almost 50% of businesses reported that cloud BI was either important or vital to their organization.
(Source: Statista.com)
28. Global Hyperscale data center numbers have more than doubled since 2015.
Since 2015, the global hyperscale data centers figure has more than doubled. By the end of 2020, this figure reached 597. It is expected to reach 700 by the end of 2021. The US is the country with the most hyperscale data centers in the world (39%).
(Source: Statista.com)
Big data consumption facts
Between 2012 and 2020, the percentage of useful data that had the potential for analysis went from 22% to 37%. This includes data from various fields, such as social media, entertainment, surveillance, and more.
Since 2017, data has been viewed as the new oil, with an increasing number of modern businesses referring to data as the new currency in the digital business realm. According to some recent stats, the big data market is currently valued at $138.9 billion and counting. Here are some interesting big data consumption stats to consider.
29. Most businesses rely on big data technologies and solutions to achieve their goals in 2021.
Some recent research indicated that more than 38% of digital businesses use the software as a service (SaaS) model to accomplish their business goals. Modern companies are also increasingly using machine learning, artificial intelligence, cloud computing, and big data to improve their operations and increase efficiency.
These modern and powerful technologies allow digital enterprises to beat their competitors and explore new business opportunities as well as to provide their consumers with more customer-centric services and experiences.
(Source: Statista.com)
30. 72% of digital businesses are using at least one of the big four technologies in industry 4.0.
Industry 4.0 will be relying even more on big data and analytics, cloud infrastructure, artificial intelligence, machine learning, and the Internet of Things (IoT) in the future.
These four technologies will form the big four technologies, with IoT in the leading position. The big four technologies are the dominating force in industry 4.0, with almost 72% of digital businesses using at least one, if not all four, to achieve their goals.
(Source: Statista.com)
31. 48% of big data and analytics leaders launched digital transformation initiatives in 2020.
In 2020, the digital business landscape went through a transformation, with 48% of big data and analytics leaders launching numerous digital transformation initiatives. Reports indicated that 72% of modern enterprises are either leading or involved in digital transformation initiatives. Data sharing, ROI from data and analytics investments, and data quality are the main priorities.
(Source: Statista.com)
32. Big data/AI technologies were adopted by 48.5% of businesses in the US in 2021.
According to the most recent reports, the current state of big data and AI adoption is strong. Most industry-leading companies in the United States and worldwide are increasingly adopting both technologies. 2021 statistics show that 48.5% of organizations rely on data to drive innovation.
(Source: Statista.com)
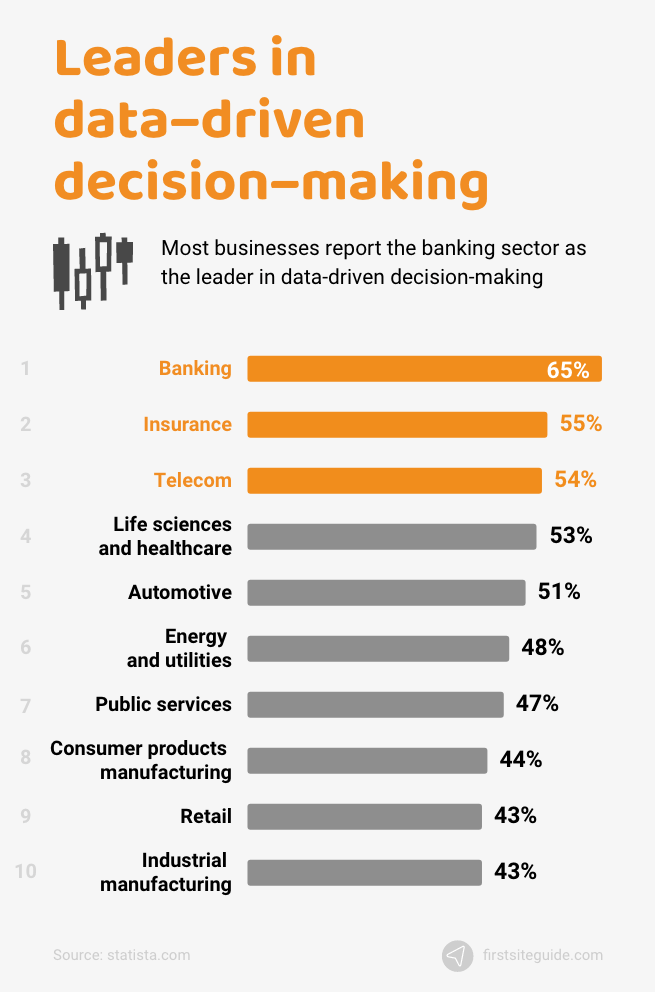
33. 65% of businesses consider the banking sector as the leader of global data-driven decision-making in enterprises in 2020.
In 2020, many industries used data to improve decision-making, with 65% of businesses reporting the banking sector as the leader in data-driven decision-making. Other sectors include insurance and telecom.
(Source: Statista.com)
34. In 2020, 77% of businesses reported the US as the leader in global data-driven decision-making.
In 2020, the statistical reports indicated that the leading country in data-driven decision-making within companies was the United States, with 77% of businesses reporting this view. Other countries in the lead were Germany and the United Kingdom.
(Source: Statista.com)
35. Competitor data was the most used external data source in 2020, with consumption of 98%.
In 2020, statistical reports indicated that data masters mostly used an array of external data sources to improve decision-making by driving actionable insights from big data. The most frequently used external data sources were:
- Competitor data (98%);
- Open data (97%); and
- Proprietary datasets from data aggregators (92%).
(Source: Statista.com)
36. 60% of businesses from the banking sector used data quantification and monetization in 2020.
In 2020, the leading sector in global data quantification and monetization was the banking sector, with 60% of enterprises using their products and services to drive insights and monetize data. In the future, global corporations should start creating products and services that capture data to monetize it effectively.
Data monetization is the process of harnessing the potential of data to acquire quantifiable economic and monetary benefits. Internal data monetization methods include using available data sets to measure business performance to improve decision-making and the overall performance of global enterprises.
On the other hand, data quantification refers to the process of adding a numerical value to a measurement of data. This type of numbering allows businesses to perform statistical analysis and mathematical calculations to improve real-life decision-making.
(Source: Statista.com)
37. In April 2021, 38% of global businesses invested in smart analytics.
In the next 12 to 18 months, forecasts indicate that global investments in smart analytics are expected to achieve a slight increase.
In April 2021, 38% of global companies reported making decisions to invest increasingly in smart analytics up to a moderate degree. Smart analytics allow enterprises to efficiently analyze huge chunks of data and drive actionable insights to improve their decision-making.
(Source: Statista.com)
38. About 2.5 quintillion bytes of data are generated each day by internet users.
In 2020, the estimated amount of data in the world was around 40 zettabytes. The most recent statistics indicate that about 2.5 quintillion bytes of data (0.0025 zettabytes) are generated by more than 4.39 billion internet users each day.
(Source: Domo.com)
Conclusion
These are the most important big data 2021 statistics to be aware of for the health of your business. The online business realm poses many challenges for modern companies, but they can easily overcome these challenges if they accept the potential that big data offers. It is and will continue to be one of the crucial technologies in the digital age.
Through big data analytics, modern businesses can forecast market fluctuations, discover more lucrative business opportunities, improve their efficiencies, beat their competitors, and provide a more customer-centric service and experience. Big data and all of its technologies are the keys to unlocking the abundant potential of the online world.

Very useful. Thanks to sources and authors. Information volume supergrowth is impressive and even a little bit frightening